(Oil & Gas 360) – Weekly Oil & Natural Gas Inventory Data Are Indicating We Head To Notably-Tighter Markets Than Stock Prices Show The Consensus Is Thinking.

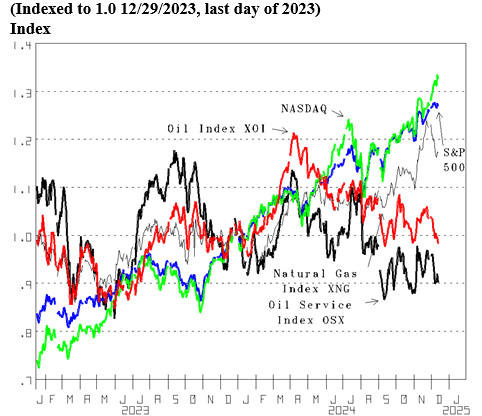
While the NASDAQ and S&P 500 show great performance and expectations, Energy stocks continue to reflect little interest/low expectations. Great performance and high expectations are evident in the NASDAQ setting another new record high Wednesday (Figure 1, green line) and the latest S&P record high set last Friday (blue line). Although the natural Gas Stock Index (XNG) is up 17.1% year to date (YTD), that is little more than half the 32.6% gain of the NASDAQ. Oil (XOI, red line) is down 1.8% YTD and the Oil Service Index (OSX, bold line) is down 9.9%.
Little interest/low expectations is also evident in the price of WTI crude oil unable to sustain a rise above $70. Preparing for Summer tugged the spot market price of West Texas Intermediate (WTI) crude oil up near $90 per barrel in April (Figure 2, red line). Since the first of November it has averaged $69.69 per barrel. And only $71 is today’s futures contract price for January, 2025 delivery.

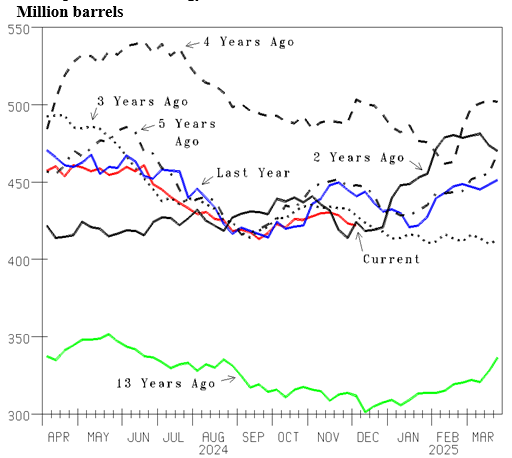
Low expectations are where we are at despite U.S. Commercial crude oil inventory low. Commercial crude oil inventory declined another 1.4 million barrels (mmb) last week to 422.0 (Figure 3, red line). That is the lowest level in the last several years, 18.8 less than last year (blue line) and 2.1 less than two years ago (bold line).
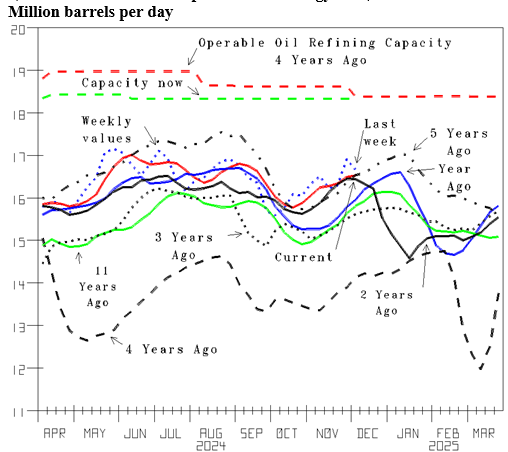
And supply/demand getting tighter is the direction we head. Refinery runs are now increasing to prepare for Winter (Figure 4, blue dot). Although runs declined 0.251 million barrels per day (mmbd) last week, inventory still declined. 16.523 mmbd the average the last four weeks (red line) is 0.567 (+3.6%) more than 15.956 last year (blue line). And runs dropped sharply two years ago (bold line) when The Climate Changed to very cold (Figure 8) that had crude oil inventory rise from the bottom of the range to the top (Figure 3).
Oil prices rising to nicely-profitable is our forecast of the direction we head. It is helped by inventory at Cushing, Oklahoma, the delivery point for futures-contract commitments down at new lows. The price of WTI crude oil was tugged up to $90 per barrel at the end of last year (Figure 2). It reflected crude oil inventory at Cushing, the futures contract delivery point falling to a multi-year low (Figure 5, blue line). Inventory here declining 1.3 mmb last week to 22.9 (red line) is a multi-year low. And prior year comparisons are on the way to tighter.

By oilandgas360.com contributor Michael Smolinksi with Energy Directions
The views expressed in this article are solely those of the author and do not necessarily reflect the opinions of Oil & Gas 360. Please consult with a professional before making any decisions based on the information provided here. The information presented in this article is not intended as financial advice. Contact Energy Directions for the full report. Please conduct your own research before making any investment decisions.