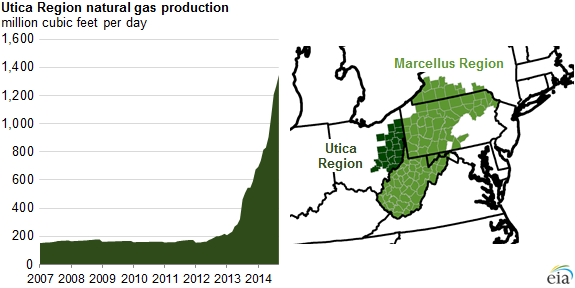
The Utica Shale made its first ever appearance on the Energy Information Administration’s (EIA) Drilling Productivity Report on August 12, 2014. The Report first debuted on October 22, 2013, and detailed various elements of six major plays, including production rates, rig counts and decline rates on legacy wells. The Utica is the first play to be added to the list, joining the Bakken, Eagle Ford, Haynesville, Marcellus, Niobrara and Permian.
Deserving Addition
The EIA reports Utica exploitation began in Ohio in 2012 but has now extended to West Virginia. The formation sprawls over much of the northeast, including Pennsylvania, New York and Maryland. Production in September 2014 is forecasted to reach 1,300 MMcf/d – a rise of more than 700% compared to January 2012 levels of 155 MMcf/d. The total represents a compounded monthly growth rate of more than 6%.

The Utica produces the smallest overall volume compared to its peers in the Report, but is expected to match gas production from the Bakken in September 2014. Plenty of work remains in the pipeline: As of August 9, 2014, the Ohio Division of Oil & Gas Resources (ODOGR) reported more than 1,400 horizontal drilling permits have been issued and more than 1,000 horizontal wells have already been drilled. Chesapeake Energy (ticker: CHK) operates the most of any E&P in the area and has drilled nearly 500 wells to date. The company will run seven to nine rigs in 2015 and expects its rate of return to reach 60%.

Rapid Rise
The popularity of the Utica Shale has risen dramatically in a very short period of time, a trend the EIA singled out in its August 12, 2014 edition of “Today in Energy.” The column says: “The Utica’s drilling productivity, or the average monthly production from new wells per drilling rig, has increased from 0.3 MMcf/d in January 2012 to an estimated 5.0 MMcf/d in August 2014. This increase has outpaced the growth rate seen in both the Haynesville Region from 2009 to 2011 and the Marcellus Region from 2010 to 2012, although current levels of drilling productivity in those areas still exceed that of the Utica Region.”
The EIA mentions production would be higher if the rig count rose, but the same capacity constraints that hinder the Marcellus also restrict the Utica. The ODOGR listed 48 rigs in operation as of August 8, which is slightly more than the Haynesville. The Marcellus, by comparison, had 74. New infrastructure, however, is on the way. As of November 2013, six new pipeline projects were under construction and an additional 19 were in various stages of the approval process. The EIA expects the expansions to add 3.5 Bcf/d of capacity by 2015.
Room to Run
If infrastructure, technology and feasibility continue, production of the Utica has a long life ahead. The EIA’s 2012 Annual Energy Outlook estimateda recoverable resource base of 15.7 Tcf. ICF International (ticker: ICFI) estimates ultimate recovery per Utica well to reach 3.3 Bcf, a 25% increase from Q1’14’s estimate of 2.5 Bcf (32% increase), and believes 500 wells will be drilled annually through 2035.
[sam_ad id=”32″ codes=”true”]
Important disclosures: The information provided herein is believed to be reliable; however, EnerCom, Inc. makes no representation or warranty as to its completeness or accuracy. EnerCom’s conclusions are based upon information gathered from sources deemed to be reliable. This note is not intended as an offer or solicitation for the purchase or sale of any security or financial instrument of any company mentioned in this note. This note was prepared for general circulation and does not provide investment recommendations specific to individual investors. All readers of the note must make their own investment decisions based upon their specific investment objectives and financial situation utilizing their own financial advisors as they deem necessary. Investors should consider a company’s entire financial and operational structure in making any investment decisions. Past performance of any company discussed in this note should not be taken as an indication or guarantee of future results. EnerCom is a multi-disciplined management consulting services firm that regularly intends to seek business, or currently may be undertaking business, with companies covered on Oil & Gas 360®, and thereby seeks to receive compensation from these companies for its services. In addition, EnerCom, or its principals or employees, may have an economic interest in any of these companies. As a result, readers of EnerCom’s Oil & Gas 360® should be aware that the firm may have a conflict of interest that could affect the objectivity of this note. The company or companies covered in this note did not review the note prior to publication. EnerCom, or its principals or employees, may have an economic interest in any of the companies covered in this report or on Oil & Gas 360®. As a result, readers of EnerCom’s reports or Oil & Gas 360® should be aware that the firm may have a conflict of interest that could affect the objectivity of this report.


