United States refineries have processed as much as 16.8 MMBOPD in each of the past two weeks, according to a report released by the Energy Information Administration (EIA) on July 24, 2014. The historic mark, based on EIA data beginning in 1989, is the highest refinery rate in U.S. history. Capacity rates also set a record, breaking the previous mark set in 2005.
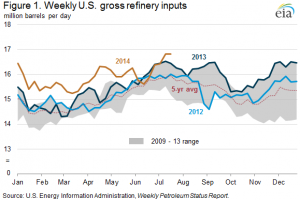 The EIA singled out consumption in the Midwest as one of the key increased areas. The EIA has five specific areas defined as a Petroleum Administration Defense Districts (PADDs), and the Midwest and Gulf Coast produce the most of the five. A previous OAG360 article on crude oil inventories pointed out the Midwest PADD was running at 100.3% capacity – the first time a regional refinery has operated above capacity since the EIA began tracking the percentages in 2010. The volume has since dipped slightly to 99.5% capacity, which is still the highest among any of the five U.S. regions. Overall refining capacity for the country remains at 93.8% for the second straight week.
Oversupplied?
“Refiners in the Midcontinent are benefiting from very inexpensive, cheaper crude, which of course is translating into higher runs,” said Andy Lipow, a consultant for Lipow Oil Associates LLC, in an interview with Bloomberg. “Margins have been good, and we’re finally at a rare period where all refineries are operating well.” Delta Airlines’ refining operations in Trainer, Pennsylvania, produced a $13mn profit in the second quarter, according to a report by Argus Media. Delta’s refiner will soon be supplying jet fuel to the airline from crude produced by U.S. operators in the Williston Basin.
 According to The Wall Street Journal, Morgan Stanley said: “The physical market appears oversupplied for now as crude supplies rebound at a time of poor refining margins.”
The EIA’s This Week in Petroleum report said, “North American refineries have been able to run at relatively high rates because their crude oil and natural gas costs were low and global product prices remained high.”
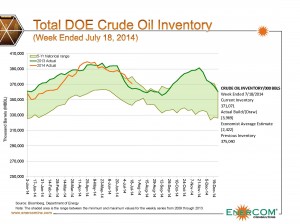
EnerCom’s Crude Oil Cuttings Inventory report shows the total supply has been on the higher end of the five year average, despite inventory draws in seven of the last eight weeks. The beginning of the high refinery runs may be traced back to April, when rates at one point exceeded the five year average by as much as 7.4%. Also of note – inventories throughout 2013 set high-water marks for the five-year range, as evidenced by the graph on the right.
Gulf Coast is the Headquarters
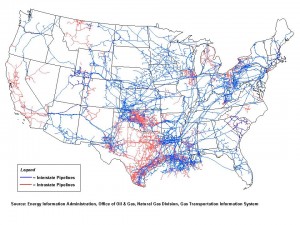 The EIA says the Gulf Coast, the PADD that produces the most of any of its peers, holds a competitive advantage due to upgraded refinery capacities and access to growing markets. Infrastructure has also improved, allowing for greater output. In May, the EIA reported refinery runs for the U.S. rose by 27% from 2010 to 2013, compared to a decrease of 11% in European markets. Despite the spread, earnings per barrel in the U.S. were still an average of $7 higher than its European competitors in 2013. The West Texas Intermediate spot price is still currently trading at a $5 discount to Brent, according to Bloomberg.
The Gulf is also located between some of the greatest oil producing regions in the country. Texas produced more than 3 MMBOPD in April 2014, which is single-handedly more than any of the other four PADDs. The emergence of the Eagle Ford and increased exploitation of the Permian has only increased Texas overall production, which has more than doubled since August 2011. The climbing production sent Gulf Coast PADD rates within a mere 1,000 BOPD of a regional record, resulting from the installation of a new pipeline with gross inputs of 600,000 BOPD. Regional output from the Gulf PADD accounted for 52% of nationwide utilization in April 2014.
The higher refinery rates on the Gulf PADD have contributed to rising export rates. An average of 2.9 MMBOPD of crude and distillate were exported from the Gulf in April 2014, which was the most ever for that particular month. Total U.S. exports for July 18, 2014, fell just shy of 3.4 MMBOPD, which is roughly double the amount from May 2010.
[sam_ad id=”32″ codes=”true”]
Important disclosures: The information provided herein is believed to be reliable; however, EnerCom, Inc. makes no representation or warranty as to its completeness or accuracy. EnerCom’s conclusions are based upon information gathered from sources deemed to be reliable. This note is not intended as an offer or solicitation for the purchase or sale of any security or financial instrument of any company mentioned in this note. This note was prepared for general circulation and does not provide investment recommendations specific to individual investors. All readers of the note must make their own investment decisions based upon their specific investment objectives and financial situation utilizing their own financial advisors as they deem necessary. Investors should consider a company’s entire financial and operational structure in making any investment decisions. Past performance of any company discussed in this note should not be taken as an indication or guarantee of future results. EnerCom is a multi-disciplined management consulting services firm that regularly intends to seek business, or currently may be undertaking business, with companies covered on Oil & Gas 360®, and thereby seeks to receive compensation from these companies for its services. In addition, EnerCom, or its principals or employees, may have an economic interest in any of these companies. As a result, readers of EnerCom’s Oil & Gas 360® should be aware that the firm may have a conflict of interest that could affect the objectivity of this note. The company or companies covered in this note did not review the note prior to publication. EnerCom, or its principals or employees, may have an economic interest in any of the companies covered in this report or on Oil & Gas 360®. As a result, readers of EnerCom’s reports or Oil & Gas 360® should be aware that the firm may have a conflict of interest that could affect the objectivity of this report.


