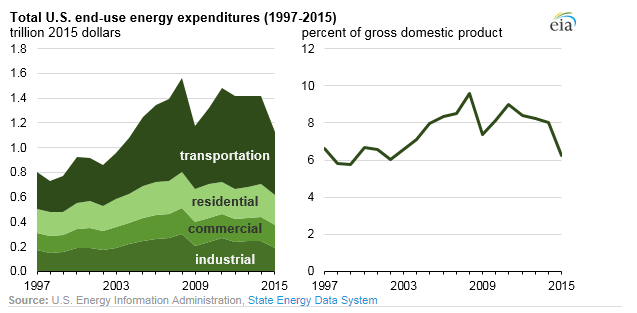
The EIA reported today that the U.S.’s expenditures for delivered energy totaled $1.127 trillion, or 6.2% of the nation’s GDP, in 2015—the lowest since 2004. The decrease was approximately 20% lower than expenses in 2014, which totaled a little over $1.4 trillion.
Decreases in transportation prices
Transportation expenditures made up approximately 45% of the $1.127 trillion, or about $507 billion. Transportation expenditures include expenditures for fuels for automobiles, rail lines, aircraft, and ships and barges. Transportation expenditures experienced a decrease of 28% due largely to decrease in fuel prices.

The EIA’s report shows that declines in petroleum product prices accounted for the majority of the overall price decline. The petroleum fuels made up the majority—97%—of total consumption in the transportation sector.
Decreases in expenditure, despite growth
The amount money spent on energy decreased despite a growing economy and growing energy use. Over 2015, the U.S. GDP increased by 2.6%, and energy use in transportation increased by 1%.
A state breakdown
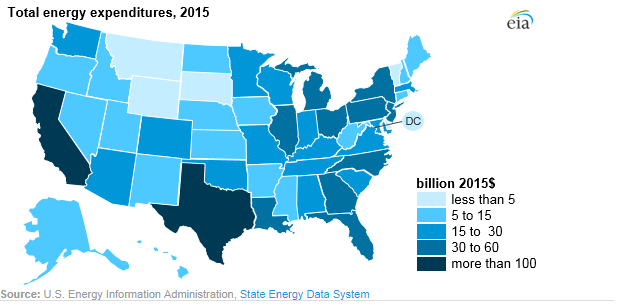
Approximately 11% of the total U.S. energy expenditures in 2015 were attributed to California and the state’s transportation expenditures accounted for 6% of the total U.S. energy expenditure. The transportation expenditures made up the majority of 47 of the 51 states’ energy expenditures, with only Connecticut, Rhode Island, Louisiana, and the District of Columbia having other sectors dominate the expenditure.

Texas claimed the highest expenditure on petroleum—spending $75 billion; California had the highest expenditure on natural gas—spending $10.7 billion; Pennsylvania spent the most on coal—$800 million; and Georgia spent the most on wood and waste biomass, at $600 million.


