Eagle Ford fields rank in top ten now, didn’t crack the top 100 in 2009
For the first time since 2009, the Energy Information Administration (EIA) published its report on the top 100 oil and gas fields in the United States.
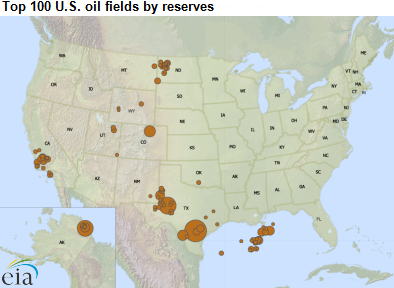
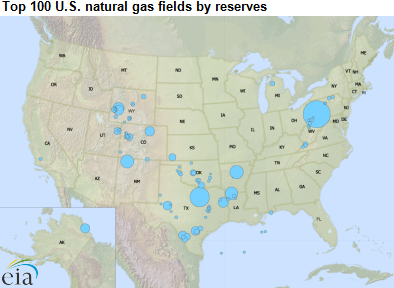
On the oil side, the report shows that the top 100 oil fields in 2013 accounted for 56% of total U.S. reserves, while the top 100 gas fields made up 68% of total U.S. reserves.

The top five oil fields in the U.S. in the new 2013 list were the Eagleville (Eagle Ford Shale) in Texas, the Spraberry Trend Area in Texas, Prudhoe Bay in Alaska, the Wattenberg in Colorado and the Briscoe Ranch (Eagle Ford Shale) in Texas.
The top five gas fields were the Marcellus Shale Area in Pennsylvania and West Virginia, the Newark East (Barnett Shale) in Texas, the B-43 Area (Fayetteville Shale) in Arkansas, the San Juan Basin in Colorado and New Mexico, and the Haynesville Shale Unit in Louisiana.
[box type=”info” size=”small” style=”rounded” border=”full”]Like this article? Sign-up for Closing Bell and we’ll e-mail you more.
[yks-mailchimp-list id=”a32a355444″ submit_text=”Closing Bell Sign-up”] [/box]
In 2009, the U.S. had 22.3 billion barrels of crude oil and lease condensate proved reserves. In 2013, the total was 36.5 billion barrels, or 63% more than four years previously. The Eagle Ford and Bakken shale plays contributed significantly to those increases. Fields in the Eagle Ford were in the top ten fields in the list, while the Eagle Ford did not even crack the top 100 the last time the list was compiled.
Similarly, the Marcellus made considerable contributions to the overall reserves in the U.S. in 2013, but was significantly lower on the list the last time it was published.

In 2009, the U.S. had 283.9 Tcf of total natural gas proved reserves, and 172.7 Tcf, or 60.8%, were located in the top 100 gas fields. Total proved natural gas reserves increased 25% to 354.0 Tcf, with 239.7 Tcf, or 67.7%, located in the top 100 gas fields.
Important disclosures: The information provided herein is believed to be reliable; however, EnerCom, Inc. makes no representation or warranty as to its completeness or accuracy. EnerCom’s conclusions are based upon information gathered from sources deemed to be reliable. This note is not intended as an offer or solicitation for the purchase or sale of any security or financial instrument of any company mentioned in this note. This note was prepared for general circulation and does not provide investment recommendations specific to individual investors. All readers of the note must make their own investment decisions based upon their specific investment objectives and financial situation utilizing their own financial advisors as they deem necessary. Investors should consider a company’s entire financial and operational structure in making any investment decisions. Past performance of any company discussed in this note should not be taken as an indication or guarantee of future results. EnerCom is a multi-disciplined management consulting services firm that regularly intends to seek business, or currently may be undertaking business, with companies covered on Oil & Gas 360®, and thereby seeks to receive compensation from these companies for its services. In addition, EnerCom, or its principals or employees, may have an economic interest in any of these companies. As a result, readers of EnerCom’s Oil & Gas 360® should be aware that the firm may have a conflict of interest that could affect the objectivity of this note. The company or companies covered in this note did not review the note prior to publication. EnerCom, or its principals or employees, may have an economic interest in any of the companies covered in this report or on Oil & Gas 360®. As a result, readers of EnerCom’s reports or Oil & Gas 360® should be aware that the firm may have a conflict of interest that could affect the objectivity of this report.


