Friday, January 31, 2025

U.S. Propane Inventories Reach All-Time High

Seasonal builds began six weeks early in 2015 U.S. inventories of propane and propylene reached 97.7 million barrels as of September 11, the highest level in the 22 years that the Energy Information Administration (EIA) has collected weekly propane inventory statistics, according to a release from the administration. In the first six months of 2015, U.S. propane and propylene inventories

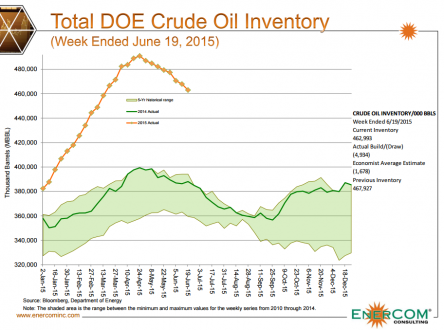
Chart of the Week: Crude Oil Inventories Steadily Retreating

But oil trades lower Crude oil inventories dropped for the eighth straight week in the Energy Information Administration’s Weekly Petroleum Status Report for the week ended June 19, 2015. Inventories peaked at 490,912 MBO in the last week of April, but have since averaged weekly declines of about 3,490 MBO. The current level of 462,993 MBO is still about 22%

Oil Price Volatility - Oil & Gas 360

Crude Oil Inventories See Largest Draw in 11 Months

Six Straight Weeks of Decline The Department of Energy reported a draw of (6,812) MBO from United States crude oil inventories for the week ended June 5, 2015, marking the largest draw of the year and the most since the week ended July 11, 2014. Inventories have now declined for six straight weeks, and amount of stored oil has dropped

Canada Oil and Gas Provinces Rank Among Best in the World - Oil & Gas 360

Cushing Inventory Still has Room, for Now

Oil inventories are at an all-time high at the Cushing delivery point in Oklahoma. Fortunately, working storage capacity is also at its highest on record, but the available space is filling up fast. In the Energy Information Administration’s (EIA) Today in Energy brief for March 23, 2015, the article details the builds in Cushing working storage capacity along with the

Chart of the Week: When will the Crude Oil Builds Stop?

Inventories at 88% of working capacity Production may be slowing in the United States, but the builds to crude oil inventories are not. The Department of Energy (DOE) reported gains for the tenth straight time in its Weekly Petroleum Status Report for the period ended March 13, 2015. This is also the eighth straight week we have achieved an unofficial

Crude Oil Cuttings for the Week Ended March 6, 2015

CRUDE OIL INVENTORY/’000 bbls (Week Ended 3/6/15) Current: 448,886 Actual Build/(Withdrawal): 4,512 Economist Average Estimate: 4,595 Previous: 444,374 Click here for the chart with five year averages. Click here for an archive of EnerCom’s Inventory Reports. ANALYST COMMENTARY KLR Group Demand Demand of ~18.6 Mmbpd decreased ~5.3% w/w, and the four-week moving average decreased ~70 bps to ~3.9% higher y/y. Gasoline demand

Crude Oil Cuttings for the Week Ended February 27, 2015

CRUDE OIL INVENTORY/’000 bbls (Week Ended 2/27/15) Current: 444,374 Actual Build/(Withdrawal): 10,303 Economist Average Estimate: 3,888 Previous: 434,071 Click here for the chart with five year averages. Click here for an archive of EnerCom’s Inventory Reports. ANALYST COMMENTARY KLR Group Demand Demand of ~19.7 Mmbpd decreased ~0.6% w/w, though the four-week moving average increased ~120 bps to ~4.6% higher y/y. Gasoline

eia

What is Fueling the Crude Oil Inventory Rally?

Crude oil inventories rose yet again in the Energy Information Administration’s (EIA) report for the week ended February 20, 2015, setting another record high. For those keeping track, the inventory has climbed by more than 60 million barrels since its report on September 25, 2014 (18%), and approximately 48.6 million barrels since the end of 2014 (11%). Why do Inventories

Crude Oil Cuttings for the Week Ended February 13, 2015

CRUDE OIL INVENTORY/’000 bbls (Week Ended 2/13/15) Current: 425,644 Actual Build/(Withdrawal): 7,716 Economist Average Estimate: 3,050 Previous: 417,928 Click here for the chart with five year averages. Click here for an archive of EnerCom’s Inventory Reports. Important disclosures: The information provided herein is believed to be reliable; however, EnerCom, Inc. makes no representation or warranty as to its completeness or

Crude Oil Cuttings for the Week Ended February 6, 2015

CRUDE OIL INVENTORY/’000 bbls (Week Ended 2/6/15) Current: 417,928 Actual Build/(Withdrawal): 4,868 Economist Average Estimate: 3,613 Previous: 413,060 Click here for the chart with five year averages. Click here for an archive of EnerCom’s Inventory Reports. ANALYST COMMENTARY BMO Capital Markets We believe this week’s data is negative for crude prices given the crude build once again exceeded expectations and pushed

Crude Oil Cuttings for the Week Ended January 30, 2015

CRUDE OIL INVENTORY/’000 bbls (Week Ended 1/30/15) Current: 413,060 Actual Build/(Withdrawal): 6,333 Economist Average Estimate: 3,940 Previous: 406,727 Click here for the chart with five year averages. Click here for an archive of EnerCom’s Inventory Reports. ANALYST COMMENTARY KLR Group Demand Demand of ~18.6 Mmbpd decreased ~9.1% w/w, and the four-week moving average decreased ~90 bps to ~3.8% higher y/y.

Crude Oil Cuttings for the Week Ended January 23, 2015

CRUDE OIL INVENTORY/’000 bbls (Week Ended 1/23/15) Current: 406,727 Actual Build/(Withdrawal): 8,874 Economist Average Estimate: 4,000 Previous: 397,853 Click here for the chart with five year averages. Click here for an archive of EnerCom’s Inventory Reports. ANALYST COMMENTARY Raymond James Equity Research This week’s petroleum inventories update was modestly bullish relative to consensus. “Big Three” petroleum inventories (crude, gasoline, distillates) rose