Wednesday, August 14, 2024
Dude, Where’s my Shareholder? - oil and gas 360

Dude, Where’s my Shareholder?

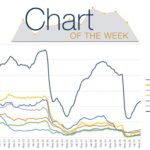
Oil & Gas 360 By Tim Rezvan, CFA – EnerCom Equity and commodity volatility are keeping the incremental energy investor away The gravy days of October seem like a distant memory for the Energy sector. After a strong YTD rally in both crude oil and energy equities (as seen below), the wheels have quickly come off for both since late

A wet gas windfall: propane inventory squeeze possible as winter approaches- oil and gas 360

A wet gas windfall: propane inventory squeeze possible as winter approaches

Oil and Gas 360 By: Tim Rezvan, CFA- EnerCom As we approach the midpoint of 3Q earnings season in the oil patch, we continue to see strong signs of capital discipline from the industry, with excess CF generally being earmarked for debt reduction, dividend growth and/or share repurchases. But while capital discipline strengthens balance sheets, it does not increase beleaguered

Chart of the Week: Rig Count by Region

By Andrew Nichols: EnerCom In the past 10 years, we have seen many shifts in the number of active oil rigs in the top 7 regions in the United States. Before 2016, when the price of oil dropped to $29 a barrel, most regions stayed about the same except for an increase in the Eagle Ford region and a large

Chart of the Week: ESG Reports and Stock Price

By Andrew Nichols: EnerCom ESG reports are a great way for companies to disclose data on how they impact the environment, social culture, and corporate governance. This practice helps to reinforce a company’s social license to operate and signals to markets that the firm is implementing best practices. We pulled data for Chesapeake Energy (CHK), Liberty Oilfield Services (LBRT), Range

Chart of the Week: Correlation Between Natural Gas and Crude Oil

By Andrew Nichols: EnerCom Historically, the price of crude oil and the price of liquified natural gas, or LNG, showed strong signs of correlation. For example, in 2017, the monthly average spot price for a MMBtu of LNG in Japan showed an 85% correlation with the price of U.S. crude oil benchmark West Texas Intermediate (WTI). However, after the massive

Chart of the Week: Rig Count and Stock Price

By Andrew Nichols: EnerCom Since August 2020, the number of United States oil and gas rigs steadily increased up to 470 oil rigs. The increase in oil rigs brings in more business and causes the price of shares for service companies to go up as shown by the OSX Index. This is a price-weighted index composed of 15 companies that

Premium Content

  • Analytics: Data,
    Dashboards, Knowledge
  • EnerCom Conference Replays
  • Exclusive Video Interviews