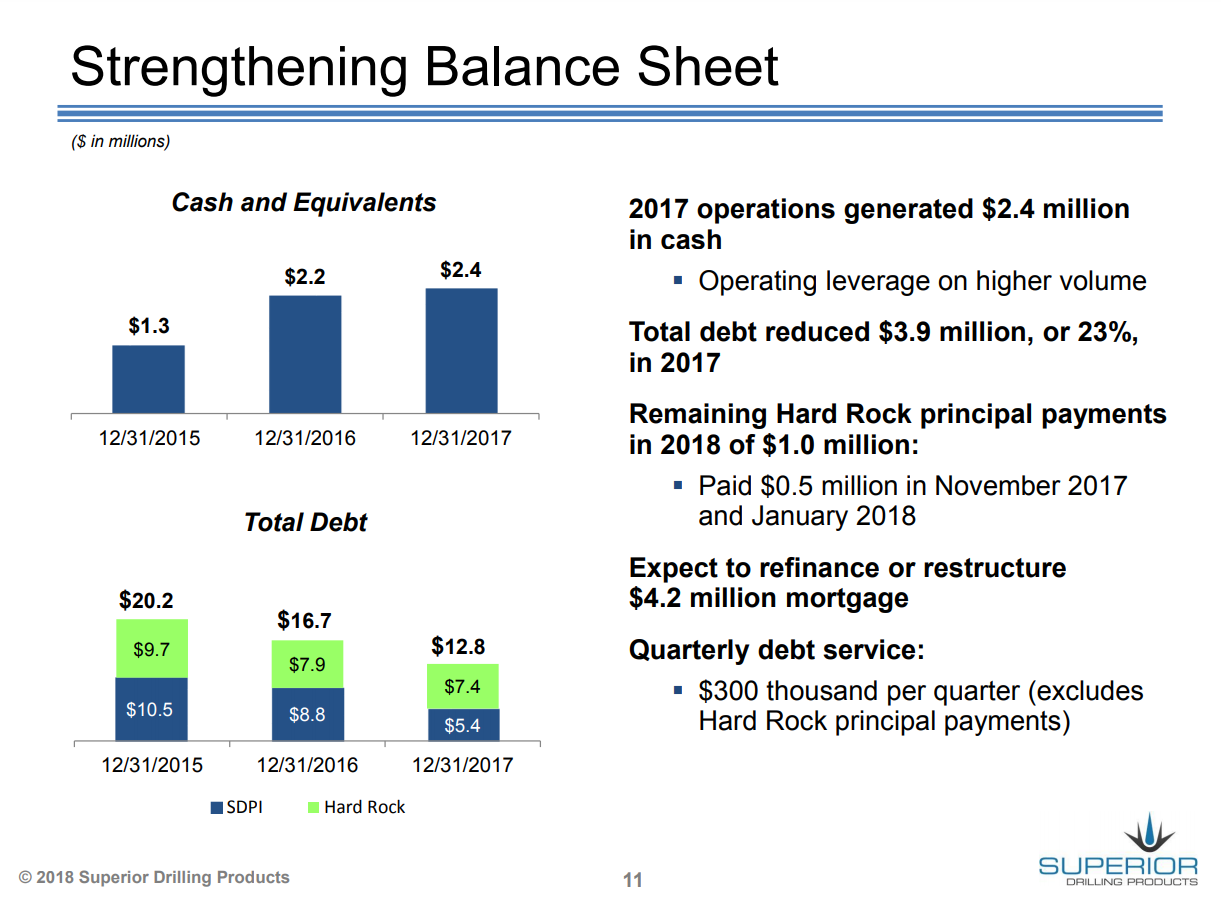
Superior Drilling Products, Inc. (ticker: SDPI) had a net loss of $786 thousand in Q4 2017, or $(0.03) per share. For 2017, the company had a net loss of $279 thousand, or $(0.01) per share. Superior reduced debt by $3.9 million, or 23%, down to $12.8 million – compared to 2016’s debt of $16.7 million.

Superior Chairman and CEO Troy Meier said, “We made excellent progress in 2017, growing significantly, generating cash and demonstrating the strength of our business model.
“We believe our flagship Drill-N-Ream® (DnR) wellbore conditioning tool is proving out its value proposition that it deserves to be on every well and we expect our StriderTM oscillation system technology will be another leading technology for the oil & gas drilling industry.
“We continue to focus on the development of new technologies, making improvements in our manufacturing processes and supply chain while building a strong, reliable team that can execute our strategy for growth.”
In Q4 2017, the company spent $90 thousand. For 2017, Superior spent $936 thousand – a significant increase over 2016’s CapEx of $353 thousand. For 2018 the company expects revenues of $18-$22 million, an operating margin of 5%-10%, interest expenses of $750 thousand, D&A of around $4 million and a CapEx of about $1 million.
2018 outlook bright
Meier added, “2018 is looking to be another exciting year for SDP as we expect another year of strong growth. We are in the process of evaluating the market share achievement of our DnR channel partner for the end of 2017, and are in conversations about our plans and expectations for 2018.
“We have a very strong partner and expect that they can meet or exceed the 17.5% market share requirement by the end of 2018. Although still in market development evaluation stages, we are really encouraged with the performance of the DnR in the Middle East and expect that to be another growth area in the latter half of 2018 and beyond.
“In addition, we have the StriderTM product line being requested and see this tool as another large future opportunity for SDP. Not losing sight of our legacy business, we are finalizing discussions with our drill bit refurbishment customer and anticipate that in the end we will be in a much better position while helping our customer succeed.”
Conference call Q&A excerpts
Q: Can you talk about the Strider and DnR technology?
Chairman and CEO Troy Meier: Okay. Yeah. So the Strider technology is the drill string enhancement technology that, that we’re just now rolling out. The Drill-N-Ream is the wellbore conditioning tool that we’ve had on to the market now for going on five years and it’s the proven tool. We’ve got over 3,500 runs. That’s the wellbore conditioning tool. The confusing part, when I was talking about Strider was looking at coiled tubing Strider, which was a market for completion of wells and Open-Hole Strider, which is a market, which are drilling the wells. Both of them need a — what it’s called an extended reach tool. And so what we’re doing is we’re blending the two together, because our designs are no longer different.
We have the design that we merge that works really well on both Open-Hole and coiled tubing. And so we just call it Strider. And you can look at the Strider in the smaller sizes, we’ll be what — we were calling coiled tubing. And the larger sizes, when we start talking the five and a quarter, 6 inch. That’s your Open-Hole Strider… that’s two different product lines and Strider is just what’s called an extended reach tool or an ERT.
Q: You had mentioned, Strider — coiled tubing Strider being used for Open-Hole drilling. Do you want to give it — can you say what basin that’s in and give us an idea of the depth of the well?
Meier: Sure. When we look at that, we’re talking about Alaska, as they’re starting to look at drilling some wells up there with — efficiently with coiled tubing. So that’s the market. The depth of those wells, it varies. I mean, they go anywhere from 3,000 feet down to 16,000 feet. It’s just they’re looking at a very efficient way of drilling wells. And without happen to have a big rig on location.
Q: At what point do you think you’d have to add some capacity to manufacturing? And the second question I have is, will you be breaking out the international revenue as it begins to become meaningful?
Meier: Well, I’ll let Chris talk about breaking out the revenue. I’ll talk towards capacity. Right now, we were running about — dependent on the week, but we’re running about 45% capacity right now. I mean, we’ve got great opportunity to go what we call lights-out operation. When we talk about the machining of parts, it’s all done on some very high tech, CMC, five axis machining centers and we’ve got those programs down. I mean, we — our team has really done a great job on that. And we can actually go two and three shifts on that.
What’s the unknown is, is on the larger tool sizes, depends on how much we started getting of these larger tool sizes, you look at — you look at 12 and a quarter inch Drill-N-Ream versus 6 inch Drill-N-Ream, it’s double the amount of the time on the machine. So as this tool fleet gets larger, we’re going to have more time per tool on a machine. But we’re still looking maybe mid-year to the end of the third quarter. Before we add another machine, which our team has identified, we’re not looking at the five axis machine, that they are in the neighborhood of about 1.2 million a piece.
We’re looking at turning center to complement the five axis machines we already have. So this turning center can do all the — what we call dirty work, and all the wrapping. And then we can take and put it into our high-end machines that do all the real fine machine to the microns.
CFO Christopher Cashion: Yeah. And with regard to breaking out international revenue, we really haven’t decided how we’re going to do that at this point. As we’ve indicated, we’re in a testing mode right now, joint market development agreement with Weatherford in the Middle East.
There is revenue-sharing 60-40. 60% of whatever we get in this testing environment. And this is with the end user, 60% comes to us, 40% to Weatherford, but we don’t expect a whole lot, that’s going to happen in the first half of the year in the testing program.
In the second half of the year, we could start seeing — we get kind of optimistic about what we might see in second half of the year. So we’ve got a few months here to kind of figure out, okay, what is the right reporting, how to break that out, if we break it out, so we’ll be talking with the investor relations about that, we’ll be talking with our auditors about that. They’re going to have an opinion, of course, we start looking at those kind of revenue break outs. But as we sit here today, we really haven’t made any decisions on how we’re going to show that.
Meier: And just to update everybody on the Mid-East, we’ve got two tools that have tidied wells over there, just in the last couple days. And we’ve got two tools in the hole right now. So it is moving forward, we’ve got 18 tools deployed over there in three different countries. It’s moving forward.
Cashion: We don’t have the test results yet. We’re doing post well analysis on those wells that have tidied.
Financial tables
| Q4 2017 financial summary | |||||||||||||||||||
| ($ in thousands,except per share amounts) | |||||||||||||||||||
| Q4 2017 | Q4 2016 | $Y/Y Change |
% Y/Y Change |
Q3 2017 | $ Seq. Change |
% Seq. Change |
|||||||||||||
| Tool sales/rental | $ | 1,434 | $ | 1,451 | $ | (17) | (1.2)% | $ | 2,012 | $ | (578) | (28.7)% | |||||||
| Other related tool revenue | 1,224 | 342 | 882 | 257.9% | 1,171 | 53 | 4.5% | ||||||||||||
| Tool Revenue | 2,658 | 1,794 | 864 | 48.2% | 3,183 | (525) | (16.5)% | ||||||||||||
| Contract Services | 1,072 | 539 | 533 | 98.9% | 1,264 | (192) | (15.2)% | ||||||||||||
| Total Revenue | $ | 3,730 | $ | 2,333 | $ | 1,397 | 59.9% | $ | 4,447 | $ | (717) | (16.1)% | |||||||
| Operating income (loss) | (670) | (2,213) | 1,543 | NM | 720 | (1,389) | (193.1)% | ||||||||||||
| As a % of sales | NM | NM | 16.2% | ||||||||||||||||
| Net income (loss) | $ | (786) | $ | (2,614) | 1,829 | NM | $ | 586 | (1,372) | (234.0)% | |||||||||
| Diluted earnings (loss) per share | $ | (0.03) | $ | (0.11) | $ | 0.08 | NM | $ | 0.02 | $ | (0.05) | (224.2)% | |||||||
| FY 2017 review | ||||||||||
| ($ in thousands,except per share amounts) | 2017 | 2016 | $ Change |
% Change |
||||||
| Tool Revenue | $ | 10,597 | $ | 5,483 | 5,114 | 93.3% | ||||
| Contract Services | $ | 4,998 | $ | 1,670 | 3,328 | 199.3% | ||||
| Total Revenue | $ | 15,595 | $ | 7,153 | 8,442 | 118.0% | ||||
| Cost of revenue | 5,960 | 4,492 | 1,469 | 32.7% | ||||||
| As a % of sales | 38.2% | 62.8% | ||||||||
| Selling, general & administrative | 5,734 | 5,776 | (41) | (0.7)% | ||||||
| As a % of sales | 36.8% | 80.7% | ||||||||
| Depreciation & amortization | 3,677 | 4,291 | (615) | (14.3)% | ||||||
| Operating expenses | 15,371 | 14,559 | 812 | 5.6% | ||||||
| Impairment of property/goodwill | – | 840 | ||||||||
| Total operating expenses | 15,371 | 15,399 | ||||||||
| Operating income (loss) | 225 | (8,246) | 8,471 | 102.7% | ||||||
| Net loss | $ | (279) | (9,129) | 8,850 | 96.9% | |||||
| Diluted loss per share | $ | (0.01) | $ | (0.48) | 0.47 | 97.9% | ||||


