Shipping choke points could be security threat
The EIA estimates that approximately 61% of the total world petroleum supply—or 58.9 million BOPD—travelled in maritime tankers. The oil in these tankers represents nearly 28% of the world’s shipping in weight alone.
The EIA defines oil chokepoints as narrow channels along widely used global sea routes. Some of these points are so narrow that only certain types of vessels are allowed to transit through them. These areas typically have high volumes of oil moving through them—and inhibiting the movement of volumes that large could impact global energy security.
The potential for these chokepoints to be blocked by pirate activity, terrorist attacks, or political unrest have the potential to impact international energy markets, not to mention the potential for such unrest to cause disastrous oil spills.
The EIA has highlighted seven chokepoints in major trade routes that could impact the international energy market.
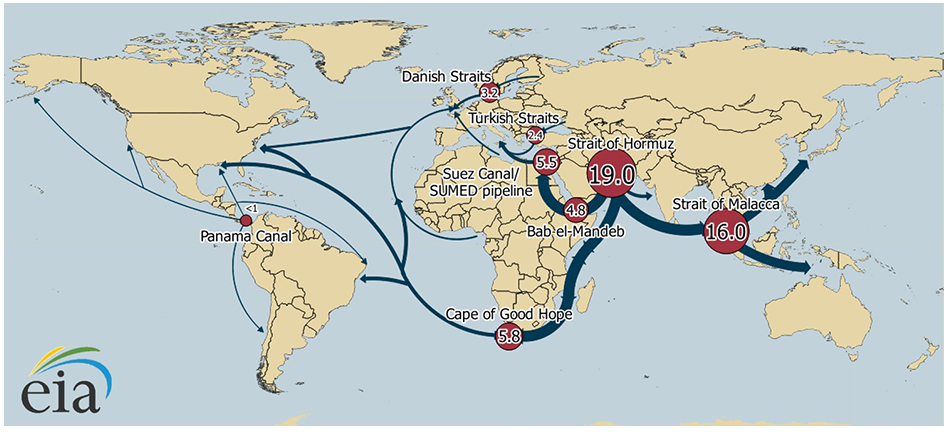
The Strait of Hormuz, which exits the Persian Gulf and the Strait of Malacca are considered the two most important strategic chokepoints.
The Strait of Hormuz alone accounted for 30% of all seaborne traded crude oil and liquids in 2015. In 2016, the amount of oil that passed through the Strait was 18.5 MMBOPD, according to the EIA.
While pipelines have the potential to act as a reasonable bypass to the Strait of Hormuz, most pipelines that could act as a bypasses are not operational currently. Saudi Arabia and the United Arab Emirates together have an estimated 6.6 MMBOPD worth of pipeline capacity; they have 3.9 MMBOPD worth of capacity that is not in use.
The Strait of Malacca—between Indonesia, Malaysia, and Singapore—accounted for approximately 16 MMBOPD of oil transport in 2016, according to the EIA.
Moving oil safely
Another important factor to consider, and one that has been in the public eye, is the varying safety of different modes of transportation for oil.
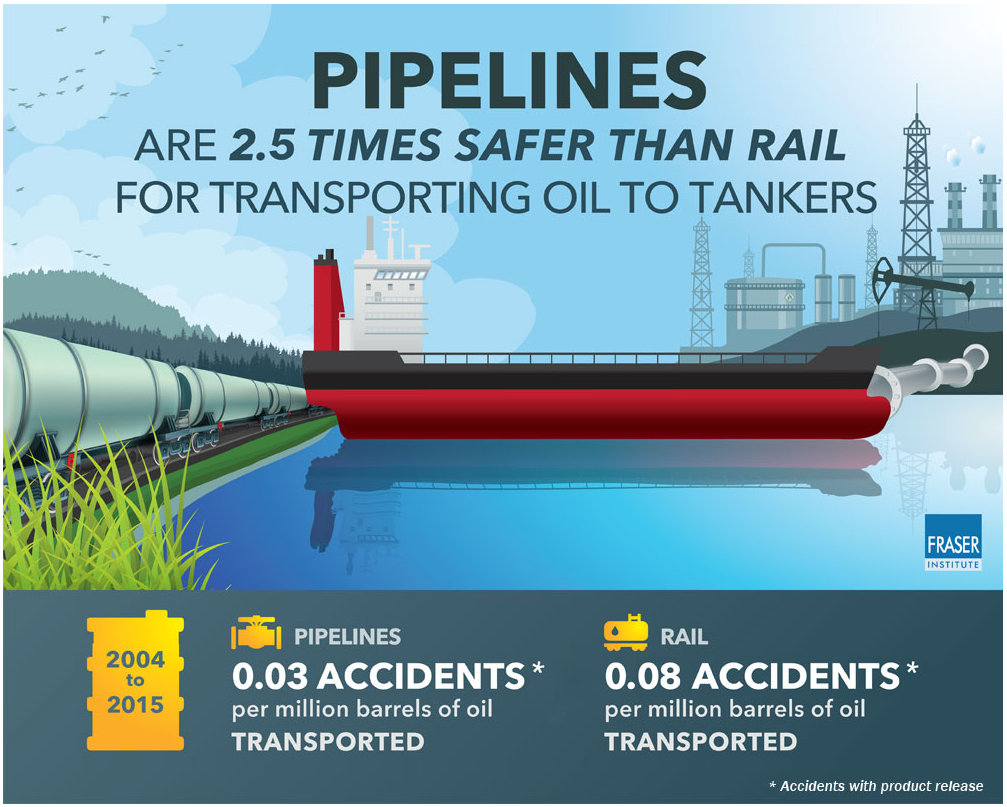
A July report by the Fraser Institute compared the safety record of pipelines, naval shipping, and railway shipping on the basis of occurrences per million barrels of oil shipped and occurrences per million barrels of oil equivalent of natural gas shipped—with occurrences defined as accidents and incidents.
Pipelines
The report found that pipelines experienced 0.04 occurrences per MMBOE of oil and 0.07 occurrences per MMBOE of natural gas. The Fraser Institute noted that even among those spills, approximately 70% of them only resulted in spills of less than one cubic meter—another 17% resulted in no spill whatsoever. Additionally, only 17% of the spills occurred along the length of a pipeline, with the remainder occurring at facilities that typically have containment measures in place for such occurrences.
Oil by rail
The number of rail-line accidents wherein oil was being transported peaked in 2013, at 22 incidents, but has since fallen to 14 in 2015. For natural gas transport, the number of rail accidents number only three in 2015, down from a peak of 39 in 2005. In oil and gas equivalent, rail lines averaged approximately 0.186 accidents per MMBOE of oil and gas transported between 2004 and 2015. In petroleum products, the value is 0.101 accidents per MMBOE, and slightly higher for natural gas at 0.311 per MMBOE.
Only 26% of petroleum product related accidents and 15% of natural gas accidents occurred in transit—with the remainder occurring at rail terminals.
Oil by tanker
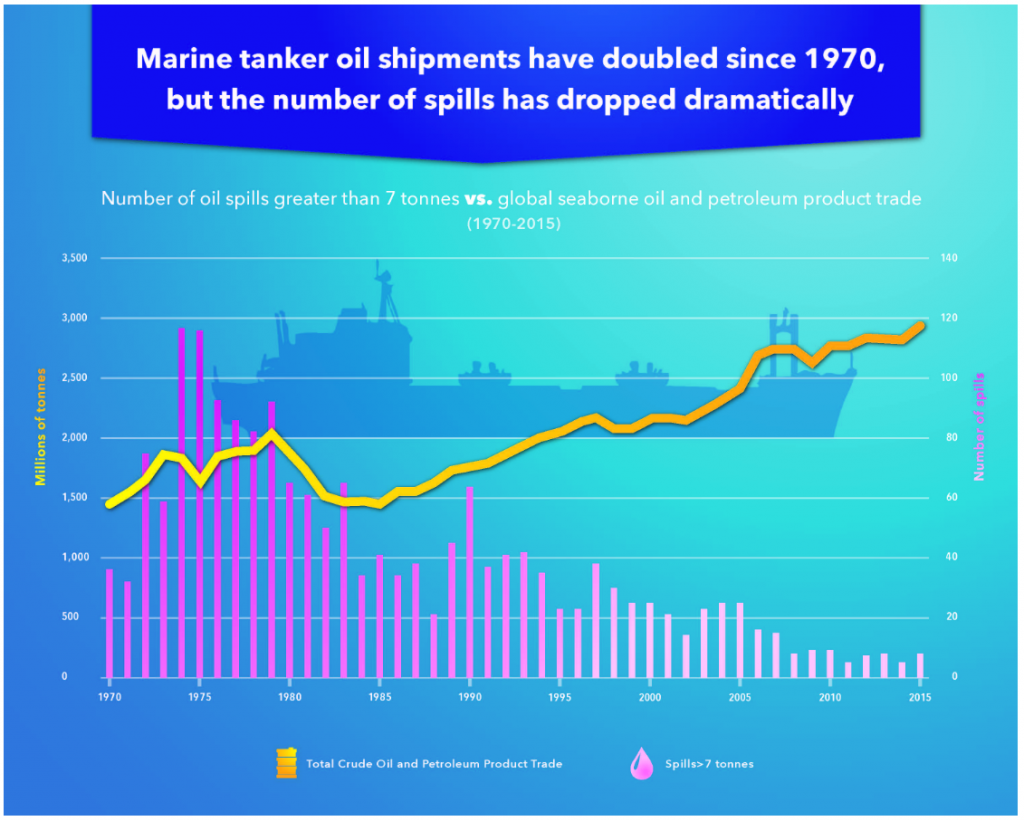
The amount of oil spilled via tanker transport has decreased drastically between 1970 and 2016—with 3,192,000 tons spilled in the 1970’s, down to 39,000 tons spilled in the years following 2010. Of those spills, the number with volumes between seven and 700 tons decreased from 543 in the 1970’s down to 35 in the years between 2010 and 2016.
Comparing modes
The Institute’s report indicated that the likelihood of a rail accident for oil was 2.6 times greater than the likelihood of a pipeline accident per MMBOE. For natural gas, the likelihood of a rail accident was 4.8 times higher than the likelihood of a pipeline accident per MMBOE. Marine transportation had the smallest likelihood of a spill at approximately 0.001 releases per MMBOE of oil and gas transported, then pipelines with 0.031 releases per MMBOE, and lastly rail transport with 0.079 releases per MMBOE. Note that the rail transport value is lower because the data is limited to rail accidents that resulted in the release of petroleum product, as opposed to the earlier value which was just for railway accidents.
