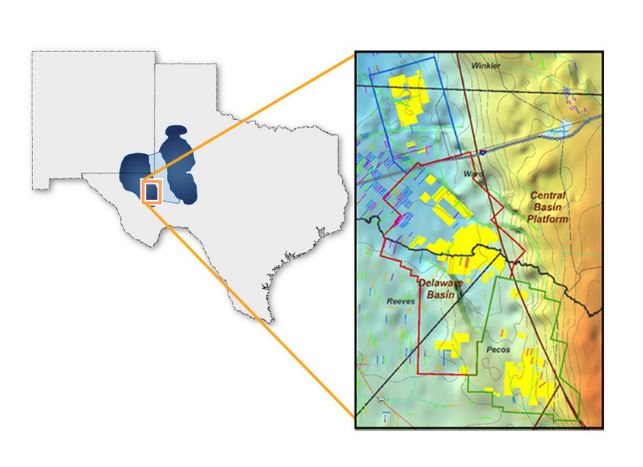
Jagged Peak Energy is developing 60,000 net acres in the Southern Delaware basin
Jagged Peak Energy (ticker: JAG), made its official debut today after the pricing of its IPO on the New York Stock Exchange. Jagged Peak also launched its new website: www.jaggedpeakenergy.com.
The stock opened at $14.18 and had traded more than 13 million shares by midday Friday.

Jagged Peak Leadership

Jagged Peak is led by Amoco/BP vet Joseph N. Jaggers. Jaggers has served as Jagged Peak’s chairman, president and CEO since April 2013. Jaggers previously served as CEO of Ute Energy, president and COO of Barrett Resources Corporation, regional vice president for Williams Companies and president, COO and director of Bill Barrett Corporation.
Former Barrett executive Robert Howard serves as Jagged Peak’s executive vice president and CFO.
Southern Delaware – the target from day one
“We were formed with the goal of building a premier acquisition and development company focused on horizontal drilling in the core oil window of the Southern Delaware Basin. … At our inception, we specifically targeted the Southern Delaware Basin due to the abundant amount of oil-in-place, stacked pay potential, low breakeven-prices, attractive well economics, favorable operating environment and in-place midstream infrastructure,” the company said in its S-1 registration statement filed with the SEC on Jan. 17, 2017.
Jagged Peak has a position of more than 60,000 net acres in the adjacent counties of Winkler, Ward, Reeves and Pecos, in the Southern Delaware basin in west Texas. As of September 30, 2016, JAG had drilled and completed 16 horizontal wells. The company operates approximately 98% of its acreage position.

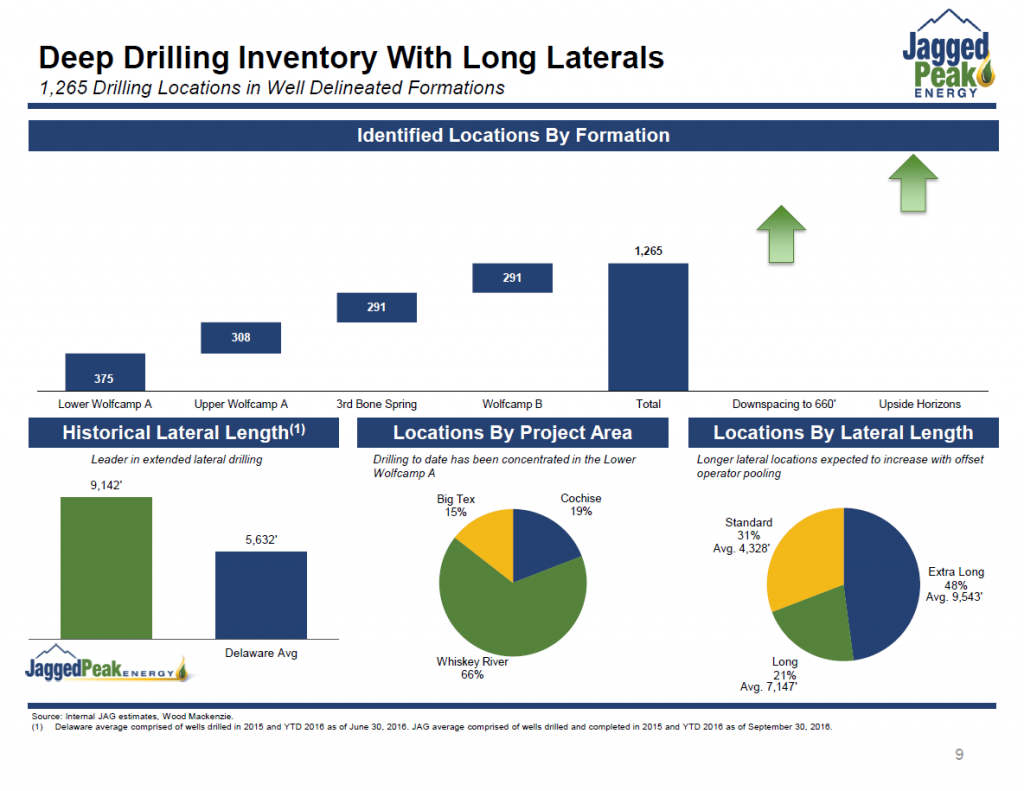
“As of September 30, 2016, we had identified 1,265 gross horizontal drilling locations in the Lower Wolfcamp A, the Upper Wolfcamp A, the Wolfcamp B and the 3rd Bone Spring Sand formations, assuming 880-foot spacing in an offset pattern and a minimum vertical separation of 175 feet within target formations,” the company reported.
“Sixty-nine percent of our identified locations are classified as long or extra-long laterals, with an average length of 8,806 feet. We expect to significantly add to our drilling inventory over time as we continue to decrease the horizontal and vertical spacing of horizontal wells, acquire additional acreage and establish the productive capability of additional zones.”
Existing operations
“We are currently operating three rigs in the Southern Delaware Basin and currently plan to add three additional rigs in 2017. During the fourth quarter of 2016, an additional five gross operated horizontal wells were placed on production,” the company said.
For the nine months ended September 30, 2016, JAG reported average net daily production was 5,339 Boe/d (approximately 83% oil, 7% natural gas and 10% NGLs).
During the nine months ended September 30, 2015, average net daily production was 2,055 Boe/d (approximately 82% oil, 8% natural gas and 10% NGLs). As of September 30, 2016, we produced from 33 operated horizontal wells (16 of which we drilled and completed) and 14 operated vertical wells.
|
|
Nine Months Ended
September 30, |
Year Ended
December 31, |
|||||||||||
|
|
2016 | 2015 | 2015 | 2014 | |||||||||
|
|
(unaudited)
|
|
|
||||||||||
|
|
(in thousands, except per share data)
|
||||||||||||
| Statement of Operations Data: | |||||||||||||
| Revenues: | |||||||||||||
| Oil sales | $ | 47,215 | $ | 21,445 | $ | 31,534 | $ | 14,605 | |||||
| Natural gas sales | 1,450 | 690 | 948 | 646 | |||||||||
| NGL sales | 2,023 | 848 | 1,329 | 1,029 | |||||||||
| Other operating revenues | 693 | 10 | — | — | |||||||||
| Total revenues | 51,381 | 22,993 | 33,811 | 16,280 | |||||||||
The following table presents historical production volumes for our properties for the nine months ended September 30, 2016 and 2015, and the years ended December 31, 2015 and 2014:
|
|
Nine Months
Ended September 30, |
Year Ended
December 31, |
||||||||||||
|
|
2016 | 2015 | 2015 | 2014 | ||||||||||
| Oil (MBbls) | 1,210 | 459 | 718 | 189 | ||||||||||
| Natural gas (MMcf) | 669 | 269 | 404 | 172 | ||||||||||
| NGLs (MBbls) | 141 | 57 | 89 | 35 | ||||||||||
| Total (MBoe)(1) | 1,463 | 561 | 874 | 253 | ||||||||||
| Average net daily production (Boe/d)(1) | 5,339 | 2,055 | 2,395 | 693 | ||||||||||
“Based on the wells we have drilled to date and wells drilled by other operators, we believe the Lower Wolfcamp A, Upper Wolfcamp A, Wolfcamp B and 3rd Bone Spring Sand formations are significantly delineated across our acreage. The top of the Wolfcamp formation ranges from approximately 8,850 feet to 11,420 feet, and the top of the Bone Spring formation ranges from approximately 8,600 feet to 10,900 feet. We also believe that significant additional development opportunities exist on our acreage in the Brushy Canyon, Avalon Shale, 1st Bone Spring Lime, 1st Bone Spring Sand, 2nd Bone Spring Sand, 3rd Bone Spring Lime and Wolfcamp C formations.
“Since commencing our drilling program in late 2013, we have consistently increased EURs and improved our well and field-level returns by refining our landing zones, drilling longer length laterals and enhancing our completion techniques.
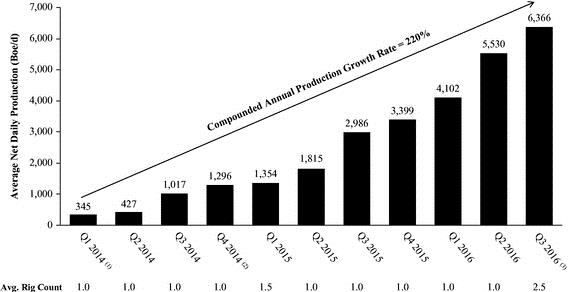
“The prolific nature of our long-lateral horizontal drilling locations and continually modified and improved completion designs have allowed us to increase our average net daily production from 345 Boe/d in the first quarter of 2014 (normalized for five days of production) to 6,366 Boe/d in the third quarter of 2016 while operating an average of one horizontal drilling rig through June 30, 2016. We began operating our second and third rigs in July of 2016 and, in 2017, we expect our drilling program to grow to six horizontal rigs, allowing us to continue our rapid production growth. Assuming this 2017 level of drilling activity, we have over 26 years of drilling inventory. The chart below shows our historical production over time.

“We added our second and third rigs during July 2016. There were no completions or production attributable to these rigs as of September 30, 2016.
Drilling locations
As of September 30, 2016, we had drilled and completed eight operated wells in the Whiskey River project area targeting the Lower Wolfcamp A, Upper Wolfcamp A and Wolfcamp B. We had drilled and completed six operated wells in the Cochise project area targeting the Lower Wolfcamp A. We had drilled and completed two operated wells in the Big Tex project area targeting the Lower Wolfcamp A. The following table provides a summary of our gross horizontal drilling locations by project area, targeted formation and lateral length as of September 30, 2016.
Gross Identified Horizontal Drilling Locations
|
|
Cochise | Whiskey River | Big Tex | Totals | |||||||||
| By Target | |||||||||||||
| 3rd Bone Spring Sand | 66 | 225 | — | 291 | |||||||||
| Upper Wolfcamp A | 53 | 171 | 84 | 308 | |||||||||
| Lower Wolfcamp A | 57 | 219 | 99 | 375 | |||||||||
| Wolfcamp B | 66 | 225 | — | 291 | |||||||||
| Total Locations | 242 | 840 | 183 | 1,265 | |||||||||
| By Lateral Length Category |
|
|
|
|
|||||||||
| Extra Long (Two Sections) | 175 | 355 | 76 | 606 | |||||||||
| Long (One and One-Half Sections) | 46 | 151 | 72 | 269 | |||||||||
| Standard (One Section) | 21 | 334 | 35 | 390 | |||||||||
| Total Locations | 242 | 840 | 183 | 1,265 | |||||||||
| Avg. Completed Lateral Length (in feet) |
|
|
|
|
|||||||||
| Extra Long | 9,587 | 9,534 | 9,480 | 9,543 | |||||||||
| Long | 6,900 | 7,273 | 7,041 | 7,147 | |||||||||
| Standard | 4,290 | 4,358 | 4,071 | 4,328 | |||||||||
| Gross Acres |
12,894 |
35,912 |
19,315 |
68,121 |
|||||||||
| Net Acres | 12,244 | 30,796 | 17,835 | 60,875 | |||||||||
| Avg. Working Interest | 95.0 | % | 85.8 | % | 92.3 | % | 89.4 | % | |||||


