Canada is home to a large number of public companies that are developing hydrocarbon resources on both sides of the border. In this series, Oil & Gas 360® takes a closer look at some of the promising operators in Canada’s E&P space.
Canada’s Economy
Canada’s GDP growth has outperformed the U.S. in four of the past five years, and growth of 2.3% is forecasted for Canada in 2014. Nick Lacy, an investment strategist at Raymond James told Financial Planning, “Canada has one of the most stable financial sectors in the world.”
Canada currently boasts a national GDP of $1.83 trillion according to the World Bank, the eleventh largest GDP in the world. One of the main sectors of the Canadian economy responsible for such an impressive GDP is the energy sector. Energy products, which include oil, natural gas and coal, make up about 24% of Canada’s overall exports, and in conjunction with mining and quarrying make up more than 8% of Canada’s total GDP. Mining, quarrying, and oil and gas extraction make up the third largest portion of Canada’s GDP, after manufacturing (about 10%) and real estate, rental and leasing (about 12%).

Oil Production in Canada
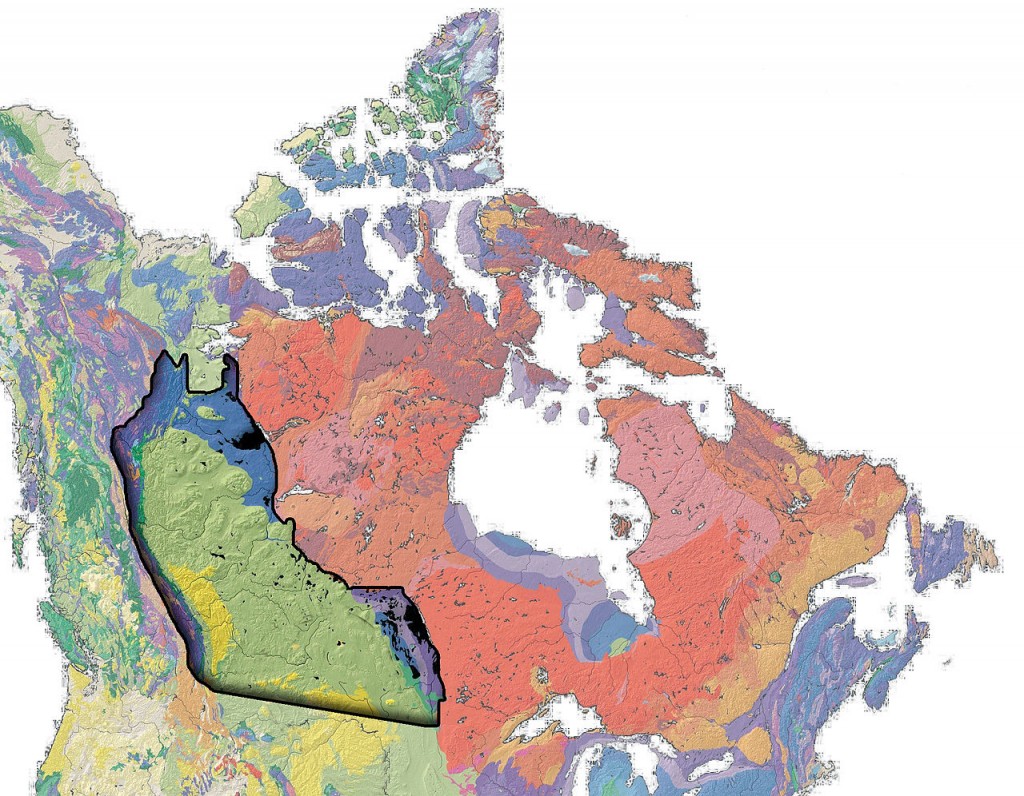
Canada has seven distinct regions of sedimentary rocks, with every province and territory containing at least a portion of a sedimentary basin. Canada’s seven basins are the Western Canada Sedimentary Basin (WCSB), Atlantic Margin, Arctic Cratonic, Arctic Margin, Eastern Cratonic, Intermontane and Pacific Margin.
Canada’s oil production comes primarily from three sources:
- The oil sands which are concentrated in three deposits – the Athabasca, Peace River and Cold Lake areas in Alberta and western Saskatchewan,
- The WCSB, which includes southwestern Manitoba, southern Saskatchewan, Alberta, northeastern British Columbia and the southwest corner of the Northwest Territories, and
- Canada’s offshore oil fields in the Atlantic.
Alberta is the main hub of Canadian oil, accounting for 78% of Canadian oil production in 2013.
The first oil discovery made in Canada was in 1850 in Lambton County, Ontario. A year after the discovery was made, the International Mining and Manufacturing Company started to exploit the oil springs. Since then, Canada’s oil industry has bloomed. The Energy Information Administration reported that Canada is the world’s fifth-largest oil producer with 173 billion barrels of proved oil reserves, the third largest proved amount in the world, after Venezuela and Saudi Arabia.
In 2013, Canada produced more than 4 million barrels per day (BOPD) of petroleum and other liquid fuels, an increase of more than 930,000 BOPD, or 23%, from the decade before. Major oil plays in Canada include the Cardium shale formation, which runs from Eastern British Columbia through Alberta and down into Montana; the Duvernay, which is located in Alberta along the foothills of the Canadian Rockies; and the Mannville Group, which extends east-west from Edmonton to Lloydminster and north-south from the Deep Basin in central west Alberta to the United States border.
The EIA forecasts that Canada will be one of the largest sources of growth in global liquid fuel supplies, both near and long-term. The EIA projections show Canada’s production growing by an annual rate of 180,000 BOPD and that production could grow to 6.7 million BOPD by 2040.
Natural Gas Production in Canada
Canada is the fifth largest dry natural gas producer in the world. The EIA estimates that Canada’s proved natural gas reserves were 67 Tcf at the end of 2012, concentrated mostly in the WSCB, and 573 Tcf of technically recoverable shale gas resources. The EIA estimated that Canada produced 6.4 Tcf of gross natural gas in 2012.
Canadian E&Ps: Who, What and Where?
In July, Toronto’s Financial Post published an infographic detailing Canada’s 50 Largest Oil & Gas Companies listed on the Toronto Stock Exchange. The Financial Post list includes integrateds, refiners and the country’s largest E&Ps.
In our series Oil & Gas 360® focuses on a mix of “pure play E&Ps” based in Canada and operating in North America. Our group is not limited to companies listed on a particular exchange, nor is it limited by market cap.
In Part One, we begin our sector review looking at four Canadian E&Ps with operations in Canada and/or the U.S.): Crescent Point Energy (ticker: CPG), DeeThree Exploration (ticker: DTX), Manitok Energy (ticker: MEI) and Tamarack Valley Energy (ticker: TVE).
Crescent Point Energy (ticker: CPG)
Comparative Financial and Operational Metrics for CPG (approximate numbers): the company’s enterprise value is $19 billion. Trailing twelve month (TTM) production is 105 MBOEPD, with 2013 proved reserves of 433 MMBOE. The company’s production is 8% natural gas, 92% oil and liquids. TTM CapEx as of June 30, 2014 is $2.3 billion. TTM EBITDA as of 6/30/14 is $2.3 billion. The company’s balance sheet at the end of 2Q 2014 reported debt of $2.7 billion. Net debt / TTM EBITDA = 1.2x.
Crescent Point Energy is based in Calgary, Alberta and focuses on developing its large, low-risk drilling inventory to maintain production, reserves and dividends. The company currently has more than 7,450 locations of development inventory and more than 700 MBOE of possible incremental reserves. Crescent Point’s assets are mostly in southern Saskatchewan and central and southern Alberta, but they are pursuing emerging plays such as the Beaverhill Lake light oil resource play in Alberta and the Bakken/Three Forks in the U.S. Crescent Point owns and operates approximately 62.5 MMcf/d of gas processing capacity, 540 oil batteries, four 60,000-barrel oil storage tanks, 70,000 BOPD of rail capacity and 8,050 miles of pipeline and reported a FY 2014 exit production of 155,000 BOEPD.
DeeThree Exploration (ticker: DTX)
Comparative Financial and Operational Metrics for DTX (approximate numbers): the company’s enterprise value is $657 million. Trailing twelve month (TTM) production is 7 MOEPD, with 2013 proved reserves of 26 MMBOE. The company’s production is 25% natural gas, 75% oil and liquids. TTM CapEx as of June 30, 2014 is $263 million. TTM EBITDA as of 6/30/14 is $127 million. The company’s balance sheet at the end of 2Q 2014 reported debt of $86 million. Net debt / TTM EBITDA = 0.7x.
DeeThree Exploration’s business is focused in the Ferguson play in southeast Alberta and the Brazeau play in west-central Alberta. The company reported average production of 10,744 BOEPD for Q3 2014, an increase of 63% over the same quarter of 2013. In its Q3 2014 fillings, DeeThree decreased operating costs to $9.63/BOE from $10.46/BOE in the same period last year. The company also reported generated funds flow from operations of $52.7 million, an increase of $23.3 million (79%) over the same quarter last year.
Manitok Energy (ticker: MEI)
Comparative Financial and Operational Metrics for MEI (approximate numbers): the company’s enterprise value is $143 million. Trailing twelve month (TTM) production is 3.4 MOEPD, with 2013 proved reserves of 9 MMBOE. The company’s production is 58% natural gas, 42% oil and liquids. TTM CapEx as of June 30, 2014 is $105 million. TTM EBITDA as of 6/30/14 is $31 million. The company’s balance sheet at the end of 2Q 2014 reported debt of $22 million. Net debt / TTM EBITDA = 0.7x.
Manitok focuses on under-developed conventional plays in the Foothills and under-exploited lands in Southeast Alberta in order to avoid the cost pressures associated with competition in unconventional opportunities. The Company operates mainly in the Canadian Foothills, where it extracts conventional oil and gas, and Southeast Alberta, where the focus is crude oil. Manitok reached new monthly highs in production in the end of 2013 with an average of 5,550 BOEPD. According to its October 2014 Corporate Presentation, Manitok’s proved plus probable reserves were at 12,149.5 MBOE. The company has approximately 173,000 net undeveloped acres in the Foothills and 96,800 contiguous net undeveloped acres in Southeast Alberta.
Manitok’s President and Chief Executive Officer Mass Geremia discussed his company’s conventional approach and its assets in Canada during EnerCom’s The Oil & Gas Conference® 19 in an exclusive video interview in August 2014.
Tamarack Valley Energy (ticker: TVE)
Comparative Financial and Operational Metrics for TVE (approximate numbers): the company’s enterprise value is $425 million. Trailing twelve month (TTM) production is 3.7 MOEPD, with 2013 proved reserves of 10 MMBOE. The company’s production is 41% natural gas, 59% oil and liquids. TTM CapEx as of June 30, 2014 is $99 million. TTM EBITDA as of 6/30/14 is $51 million. The company’s balance sheet at the end of 2Q 2014 reported debt of $44 million. Net debt / TTM EBITDA = 0.9x.
Tamarack Valley Energy is another E&P involved in the identification, evaluation and operation of resource plays in the WCSB. Its suite of oil-focused assets provides exposure to Cardium light oil resource plays in Lochend, Garrington/Harmattan and Buck Lake in Alberta, Viking oil resource plays in Redwater, Foley Lake and Westlock in Alberta, and heavy oil opportunities southeast of Lloydminster in Saskatchewan. The company recorded production rates of 7,400 BOPD in October 2014, excluding 550 BOPD of shut-in production associated with TransCanada Pipeline maintenance and third party plant turnarounds. The company is trying to reduce well equipping costs by approximately $300,000 per well by tying wells into existing infrastructure that they own, rather than equipping them as single-well batteries. During 2014, Tamarack entered into or agreed to terms for 20 total tuck-in deals, adding a total of 35.88 sections of undeveloped land in the greater Pembina area of Alberta. In its Q2 2014 reports Tamarack reported revenue of $27.1 million, up from $10.7 million in the same quarter of the previous year.
Watch for Part Two: Oil & Gas 360® Looks at Canada’s E&Ps – Next Week
Important disclosures: The information provided herein is believed to be reliable; however, EnerCom, Inc. makes no representation or warranty as to its completeness or accuracy. EnerCom’s conclusions are based upon information gathered from sources deemed to be reliable. This note is not intended as an offer or solicitation for the purchase or sale of any security or financial instrument of any company mentioned in this note. This note was prepared for general circulation and does not provide investment recommendations specific to individual investors. All readers of the note must make their own investment decisions based upon their specific investment objectives and financial situation utilizing their own financial advisors as they deem necessary. Investors should consider a company’s entire financial and operational structure in making any investment decisions. Past performance of any company discussed in this note should not be taken as an indication or guarantee of future results. EnerCom is a multi-disciplined management consulting services firm that regularly intends to seek business, or currently may be undertaking business, with companies covered on Oil & Gas 360®, and thereby seeks to receive compensation from these companies for its services. In addition, EnerCom, or its principals or employees, may have an economic interest in any of these companies. As a result, readers of EnerCom’s Oil & Gas 360® should be aware that the firm may have a conflict of interest that could affect the objectivity of this note. The company or companies covered in this note did not review the note prior to publication. EnerCom, or its principals or employees, may have an economic interest in any of the companies covered in this report or on Oil & Gas 360®. As a result, readers of EnerCom’s reports or Oil & Gas 360® should be aware that the firm may have a conflict of interest that could affect the objectivity of this report.


