EnerCom Analytics’ September Industry Trends Report Examines Oil Prices

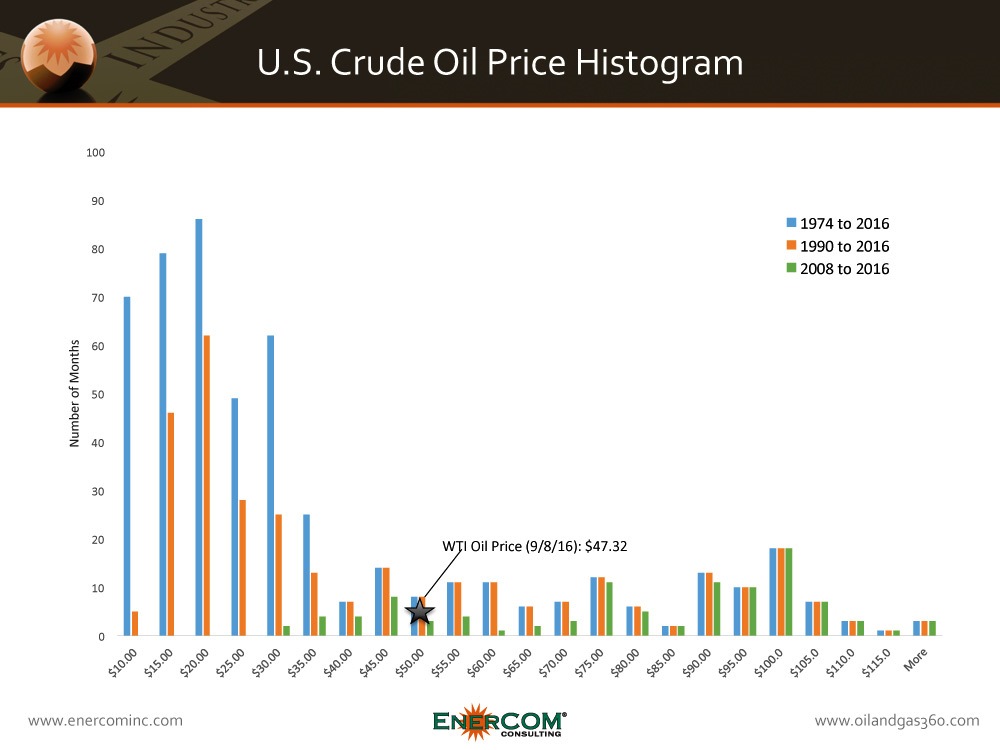
The current price of oil may feel low given the fading memories of $100 per barrel oil back in 2014. But in a longer term historical context, we are on the high end of the curve at today’s prices.
EnerCom Analytics looked at historical monthly crude oil prices between 1974 and August 2016. The chart shows the histogram of prices for three time periods—1974 to 2016, 1990 to 2016 and 2008 to 2016, with the closing West Texas Intermediate crude oil (WTI) price on September 8, 2016 of $47.32 marked for comparison. The chart shows duration in months for every $5 price increment between $10 per barrel and $115+ per barrel.
July 2005 was the first time that U.S. oil prices hit the $50 per barrel mark. That was about the same time that the combo of horizontal drilling + hydraulic fracturing started to change the USA’s effect on global oil.
Companies forced by prices to innovate
At $100 per barrel, efficiency isn’t as much of a necessity to make money in the oil business as it is at $50. In sub-$50 environments, operators found a way to generate returns. Parke A. Dickey, petroleum geologist once said: “We usually find oil and gas in new places with old ideas. Sometimes, also, we find oil and gas in an old place with a new idea, but we seldom find much oil and gas in an old place with an old idea. Several times in the past we have thought that we were running out of oil and gas, whereas actually we were only running out of ideas.”
Right now there are a lot of good ideas being tested in the field. Low prices force companies to think of new ways to produce more oil while cutting costs, and operators are executing. Oil and gas c-suites are now looking to a $50 price environment as being a manageable commodity price for operators to return to a normalized growth plan. It was only 18 months ago when operators said oil needs to be $70 per barrel to be economic.
EnerCom’s September “Industry Trends Report”
In EnerCom’s September “Industry Trends Report,” we review the current drivers of WTI pricing. Because oil is a globally traded commodity with numerous possibilities for arbitrage, worldwide benchmark prices often move in sync with one another and are affected by the same global events, trends, and conditions. Thus, although WTI is a benchmark for U.S. light, sweet crude oil, attempting to understand its dynamics requires a look beyond U.S. borders at the factors affecting world oil markets. EnerCom Analytics uses its proprietary WTI price model to provide insights into present and future commodity markets.
EnerCom Analytics’ Industry Trends Reports are published monthly and contain approximately 90-100+ pages of charts and analysis. They are written for financial industry professionals, oil and gas management executives and boards of directors, investor relations professionals and energy investors. EnerCom Analytics’ reports may be sampled and purchased here.


