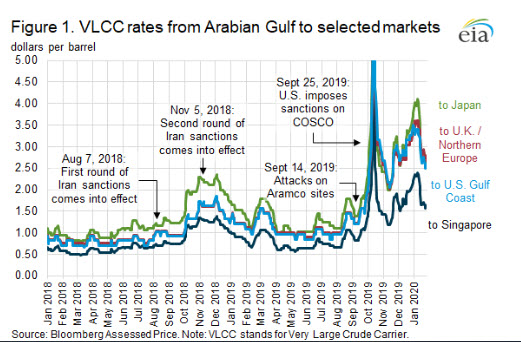
Following nearly 10 years of relative price stability, shipping rates for crude oil tankers have fluctuated widely since mid-2018 because of a combination of geopolitical events and changes to maritime fuel specifications. The U.S. Energy Information Administration (EIA) estimates that an average of 100.8 million barrels per day (b/d) of liquid fuels were consumed globally in 2019. Approximately 42% of global crude oil was transported by waterborne vessels. Although some—typically larger—oil companies own and operate their own fleet of tankers, most crude oil is transported by specialized shipping companies, which charge either the buyers or sellers a fee for their service, known as the freight or charter rate. As seen in Figure 1, these rates charged by shipping companies can vary considerably depending on both macro-level factors, such as the supply of available vessels and the demand for crude oil, and micro-level factors, such as a vessel’s hull configuration, age, route, size, and the share of its capacity that a delivery will use.

The price to charter a crude oil tanker is not fixed, and has varied over time; the price for the benchmark routes shown in Figure 1 averaged between $0.98 per barrel (b) and $2.04/b for oil transported between 2010 and 2017. For instance, the cost to charter a Very Large Crude Carrier (VLCC)—a type of tanker that typically carries approximately 2 million barrels and represented 47% of crude oil total tanker tonnage in 2019—for a voyage from the Arabian Gulf to Japan averaged $1.61/b between 2010 and 2017. Over the past two years, however, crude oil shipping rates have proved particularly volatile. Prices for the Arabian Gulf to Japan VLCC route rose to a 9-month high of $1.35/b on August 22, 2018; reached a 32-month high of $2.35/b on December 4, 2018; and reached at least a 20-year high of $8.89/b on October 14, 2019. Although prices have come down from the October 2019 high, they remain relatively elevated. January 2020 prices for the same Arabian Gulf to Japan VLCC route averaged $3.39/b, a level not seen since July 2008 during which Brent and WTI prices reached their all-time nominal daily highs of $143.95/b and $145.31/b, respectively.
[contextly_sidebar id=”EhRhsraXtSFr6Sz1Wm1ZvnjCb007OVtJ”]
Shipping rates increased in October and November 2018 following the re-imposition of sanctions on Iran by the U.S. government. Although sanctions did reduce Iranian crude exports—and, by extension, demand for crude oil tankers—they also limited the availability of tankers owned by the National Iranian Tanker Company, the owner of one of the world’s largest crude oil tanker fleets. The effect on shipping rates caused by the decline in Iran-based tanker traffic was further amplified by increased exports by other oil producers.
The September 2019 increase in shipping rates was also the result of other geopolitical events. Following the September 14 attacks on Saudi Aramco facilities at Abqaiq and Khurais, crude oil prices rose to an intraday high of $71.57/b. Although the attacks did temporarily reduce Saudi production—and, by extension, the demand for ships to carry Saudi crude oil—shipping rates rose in the immediate aftermath. One week after the attack, VLCC rates for the route from the Arabian Gulf to the United Kingdom and Northern European continent had risen 28% relative to September 13, the day before the attacks. The rise in rates is likely the product of multiple offsetting factors, including increased exports from other producers, the perceived intensification of risk of future disruptions, increased maritime insurance rates, and the release of limited volumes of Saudi crude oil inventories to meet pre-existing export commitments. Tanker rates also rose after several shipowners, including Saudi Arabian firm Bahri and Brazillian firm Petróleo Brasileiro (Petrobras) announced that they were suspending tanker voyages through the Strait of Hormuz, thereby reducing the supply of available tankers.
On September 25, the U.S. Department of the Treasury implemented sanctions on two subsidiaries of Chinese shipping firm COSCO, placing the companies on the Office of Foreign Assets Control’s list of Specially Designated Nationals, and effectively taking between 40 and 50 crude oil VLCCs and 80 other oil tankers off of the market. Furthermore, many shipping market participants were unsure if additional sanctions would be extended to other COSCO subsidiaries, or to other shippers who had potentially violated U.S. sanctions. Consequently, many charterers avoided not only ships that were directly affected by sanctions, but also those that could conceivably be sanctioned in the immediate future. When coupled with preexisting sanctions on ships transporting sanctioned crude oil from Iran and Venezuela, this last round of sanctions and the initial uncertainty it imposed significantly affected the availability of crude oil tankers. Shipbroker ACM Braemar’s concluded that around 20% of VLCCs were “relatively restricted” from transporting crude oil. The sanctions on COSCO were partially lifted, however, on January 31, 2020, an action that is likely to reinforce the broader fall in tanker rates that began earlier in the month.
The disruption caused by these geopolitical events also coincided with a fleet-wide switch in ship fueling practices. On January 1, 2020, new regulations from the International Maritime Organization (IMO 2020) came into effect that limited the sulfur content in marine fuels used by ocean-going vessels to 0.5% by weight. Although the full impact of the IMO 2020 regulations will not be known for some time, early reports suggest that the standard has had two primary impacts on tanker rates.
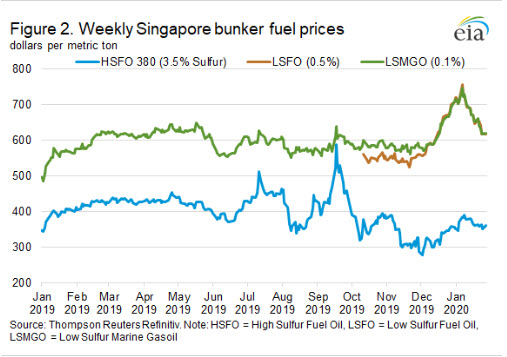
First, many shipowners have switched away from high sulfur fuel oil (HSFO) to fuels with lower sulfur content such as low sulfur marine gasoil (LSMGO) and low sulfur fuel oil (LSFO). Although differences in their energy content and performance characteristics complicate direct comparison, both LSMGO and LSFO fuels are more expensive than HSFO (Figure 2). As of January 2020, LSMGO and LSFO were sold at an average premium to HSFO of $309 per metric ton and $310 per metric ton, respectively, in Singapore’s bunker markets. An increase in operating costs generally results in increased charter rates.

Second, some shipowners have instead chosen to retrofit their vessels with new scrubbers that allow them to continue burning the same fuels while still complying with IMO 2020 regulations. These retrofits do take time, however, and Pareto Shipbrokers estimates that IMO-induced retrofits might temporarily remove ships equivalent to approximately 2% of the crude oil tanker fleet’s total capacity. Although their effect on tanker rates is almost certainly not as impactful as the geopolitical implications of sanctions and other oil market disruptions, IMO 2020 regulations are still significant and they are more likely to shape long-run charter prices.
U.S. average regular gasoline and diesel prices decline
The U.S. average regular gasoline retail price fell more than 5 cents from the previous week to $2.46 per gallon on February 3, 20 cents higher than the same time last year. The East Coast, Midwest, and Gulf Coast prices each fell nearly 6 cents to $2.39 per gallon, $2.31 per gallon, and $2.14 per gallon, respectively, the Rocky Mountain price declined nearly 3 cents to $2.53 per gallon, and the West Coast price fell almost 2 cents to $3.16 per gallon.
[contextly_sidebar id=”bVl3xwm2Rvt4Kdf9kK44sn4Bwi3Qh0OW”]
The U.S. average diesel fuel price fell more than 5 cents from the previous week to $2.96 per gallon on February 3, 1 cent lower than a year ago. The Midwest and the Gulf Coast prices each declined more than 6 cents to $2.84 per gallon and $2.71 per gallon, respectively, the West Coast price fell nearly 5 cents to $3.52 per gallon, the East Coast price fell more than 4 cents to $3.00 per gallon, and the Rocky Mountain price declined 4 cents to $2.94 per gallon.
Residential heating fuel prices decrease
As of February 3, 2020, residential heating oil prices averaged more than $2.94 per gallon, more than 5 cents per gallon below last week’s price and nearly 24 cents per gallon lower than last year’s price at this time. Wholesale heating oil prices averaged more than $1.73 per gallon, more than 10 cents per gallon below last week’s price and almost 30 cents per gallon lower than a year ago.
Residential propane prices averaged nearly $1.99 per gallon, almost 1 cent per gallon below last week’s price and nearly 45 cents per gallon less than a year ago. Wholesale propane prices averaged almost $0.59 per gallon, nearly 2 cents per gallon higher than last week’s price but 24 cents per gallon below last year’s price.
Propane/propylene inventories rise
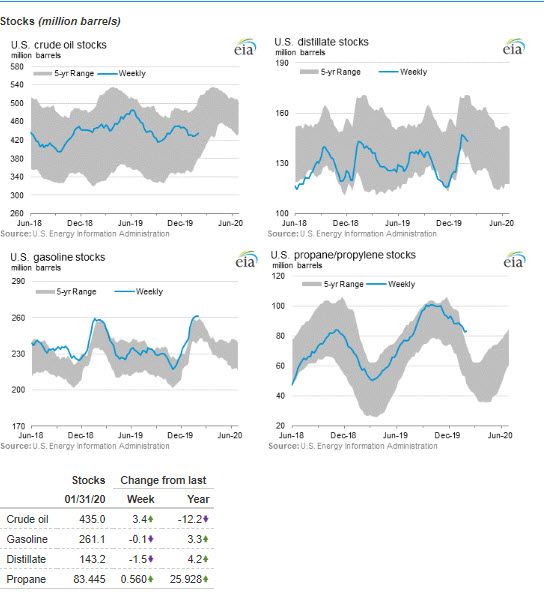
U.S. propane/propylene stocks increased by 0.6 million barrels last week to 83.4 million barrels as of January 31, 2020, 21.9 million barrels (35.7%) greater than the five-year (2015-19) average inventory levels for this same time of year. Gulf Coast and East Coast inventories increased by 1.1 million barrels and 0.5 million barrels, respectively. Midwest and Rocky Mountain/West Coast inventories decreased by 0.8 million barrels and 0.2 million barrels, respectively. Propylene non-fuel-use inventories represented 6.6% of total propane/propylene inventories.


