(Oil & Gas 360) – Last Week Helping Those Fearful Of Mankind’s-Carbon-Dioxide And Natural Gas & Oil Bearish Remain So, Have Those Of Us Bullish Set To Be Rewarded.

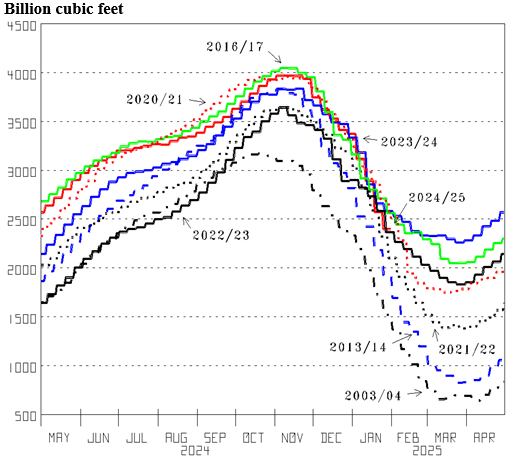
The last two weeks nicely mild are keeping most unaware that natural gas inventory has changed from being 184 Bcf more than the year before and 284 Bcf more than the five-year average at the end of November to being 208 less than last year and 111 less than the five-year average January 31. Last Winter delightfully mild and the Fall-fall in temperatures taking its time had working natural gas inventory up in record-high territory as November ended (Figure 5, red line). 3,937 Bcf on November 29 was 185 more than the year before (red line) and 284 more than the 3,653 Bcf average the prior five years. However, the four weeks colder than normal since then have 2,397 Bcf on January 31st 208 Bcf less than last year and 111 less than the average the last five years.
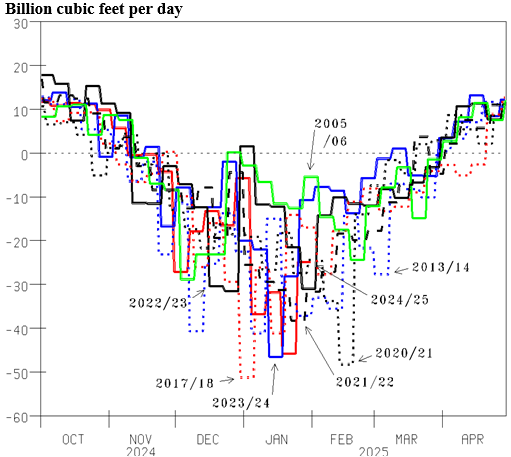
And the remainder of last Winter and the Winter before delightfully mild have us looking for a bullish Change in the natural gas market, from looking for “Where do we put it” to “Where do we get it.” Last Winter delightfully mild had the quantity of natural gas needed from inventory up at the bearish, top-of-the-historical range (Figure 6, blue line). And two Winters ago up there from February to mid-March (bold line).
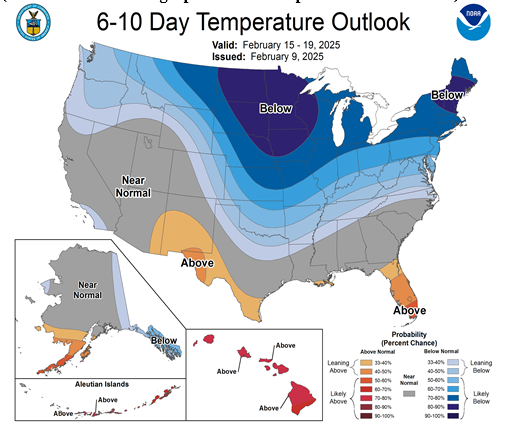
Our bullish outlook is supported by the latest temperature forecasts showing The Climate Changing to natural gas and oil demand stimulated. While many/most believe that the Earth’s carbon dioxide content causes the Earth’s temperature to be what it is, we credit temperature Change to wind-pattern Change. And the latest forecast has a significant shift to cold air (that does indeed exist/not CO’2d away) being blown South (Figure 7, shades of blue) that will make February notably colder than the January 31 prediction (Figure 2).
And continuing to have more of the U.S. population cold. The latest prediction highlights that cold air does indeed exist. It also predicts that most of where Americans live will experience colder-than-normal temperatures (Figure 8, shades of blue), a significant change from last Winter and the Winter before. Plus, the temperature predictions have been consistently too warm. And, cold air indeed existing can significantly tug natural gas and oil prices above currently low, consensus-thinking levels.
![Figure 8: Temperature Forecast – February 17 to 23, 2025 8-14 Day Outlook; Departure from Normal(Src: National Oceanographic and Atmospheric Admin. [NOAA])](https://www.oilandgas360.com/wp-content/uploads/2025/02/Energy-Market-Assessment-Fig8-02112025.png)
The views expressed in this article are solely those of the author and do not necessarily reflect the opinions of Oil & Gas 360. Please consult with a professional before making any decisions based on the information provided here. The information presented in this article is not intended as financial advice. Contact Energy Directions for the full report. Please conduct your own research before making any investment decisions.