(Oil & Gas 360)- While delightfully mild temperatures are minimizing oil & natural gas demand, prices, and expectations, infrastructure trends are bullish.
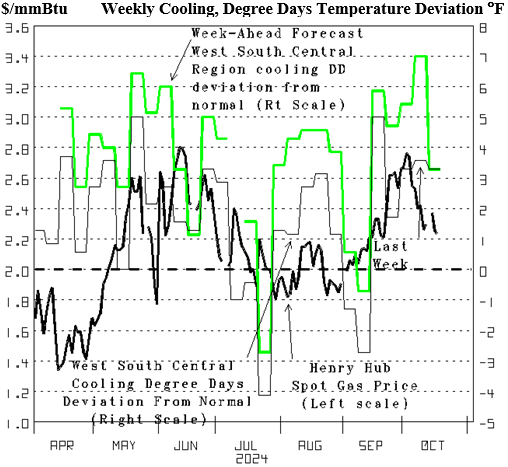
Most of the summer was warmer than normal, and two devastating Hurricanes encouraged those convinced using fossil fuels has mankind heading to disaster, adding to the many disaster predictions that have already failed. Only five Summer weeks were cooler than normal (Figure 3, line versus bold dash, right scale), reminding us that The Climate does Change despite most weeks being warmer than normal. This degree-day temperature data is also a reminder that the temperature forecasts (green line) are very consistently too warm.

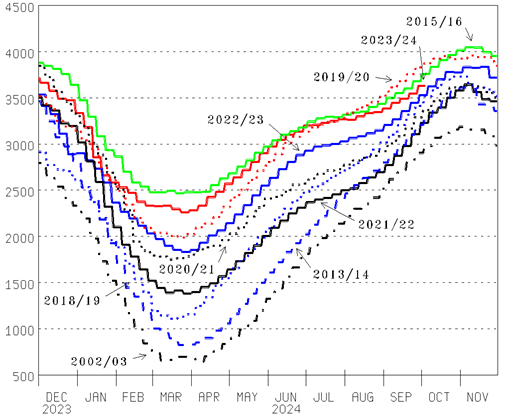
Infrastructure trends having the warm temperatures needing more natural gas to keep us cool is very evident in natural gas inventory being well-above prior-year levels at Winter’s end but bullishly closer now. Working natural gas inventory ended the Winter at 2,259 Bcf at the end of March (Figure 4, red line). That is a huge surplus versus the cold winter of 2002/03 (bold dot-dash) and 2013/14 (bold blue dash). Back then on March 29, 2,259 was 633 Bcf more than the five-year average of 1,626. 3,705 last Friday is only 163 more than the 5-year at 3,542.

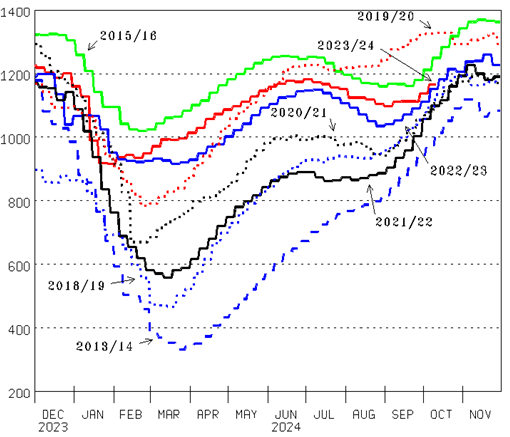
Long-term infrastructure trends have natural gas demand rising to generate electricity. It is evident in how little South-Central Region natural gas inventory has increased from the end-of-Winter low (Figure 5, red line) versus the huge increase after Winter 2013/14 (blue dash).

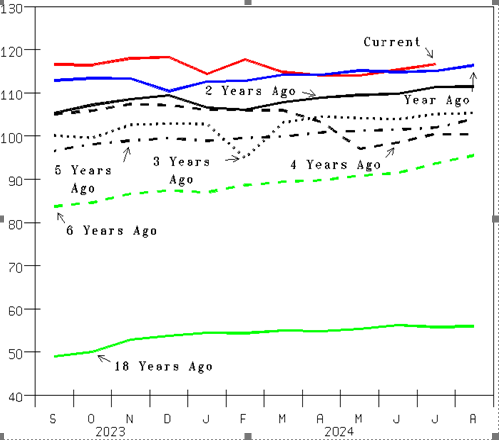
Infrastructure decisions have us heading to little if any natural gas production growth. The amazing success of the Fracking Revolution has more than doubled U.S. lower-48-state natural gas production. Back in 2005 it was down at 50 Bcf per day (Bcf/d, Figure 6, green line). 118.243 is the new record high set last December (red line). However, 116.705 in July the latest number is lower than that and only 0.257 more than 116.448 last year in August (blue line).

By Mike Smolinski with Energy Directions for oilandgas360.com


