(Oil and Gas 360) – Colder Than What Was Expected And Predicted, But Most Still Bearish Has Them Set Up To Soon Be Caught Natural Gas Supply/Investing Short.

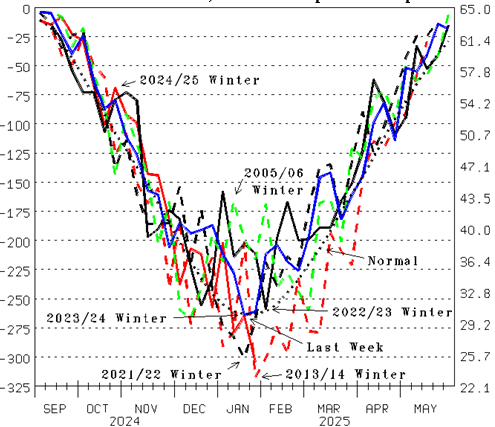
For natural gas heat the temperatures of late are not as cold as the brief episode at this time last year. Two weeks ago 244 natural-gas-heat weighted heating degree days were experienced (Figure 5, red line), equivalent to 30.1 °F, 2.6 colder than normal (bold dot). 231 experienced last week is equivalent to 32.0 °F, 0.7 colder than normal but 5.4 °F warmer than last week last year (blue line), the week that needed 326 Bcf from natural gas inventory. However, two weeks ago to this week last year needed 677 Bcf from inventory. The 258 needed two weeks ago is already 38% of that total. Last week cold, this week predicted to experience a Winter to date large of 265 heating degree days (a 27.1 °F average) has us conclude that the consensus will soon learn natural gas inventory is notably less than they expect. A larger refill will be needed.
![Figure 5: U.S. Weekly Heating Degree Days; Natural-Gas-Heat Weighted Actual degree days versus forecast for the week (Src: National Oceanic and Atmospheric Administration [NOAA])](https://www.oilandgas360.com/wp-content/uploads/2025/01/Energy-Market-Assessment-Fig5-01242025.png)

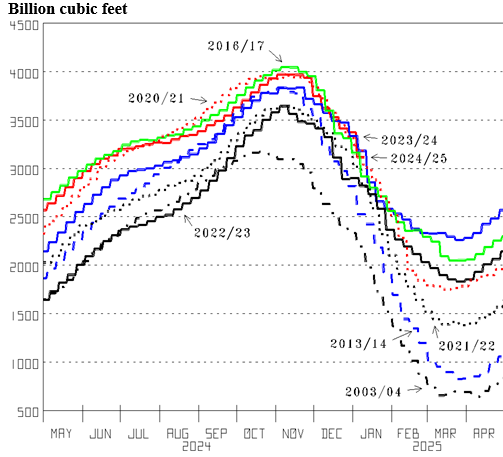
Natural gas inventory up high is helping have almost all be natural gas bearish. Along with the notion that our new Administration will reduce oil and natural gas prices. However, this Winter’s 857 Bcf inventory draw through two weeks ago (Figure 7, red line) the largest in the last seven years and 247 Bcf larger than last year to January 10th (blue line) supports our prediction: natural gas supply growth is behind natural gas demand growth.

Mid-January notably colder than normal will need much more natural gas inventory than what wasn’t needed during the Warm Fall fall in temperatures. And the rest of the last two Winters minimal too. We predict years of profitable investing as thoughts of “Where do we get it?” replace “Where do we put it?” We don’t yet know how much inventory was needed last week and this. However, the draw two weeks ago (Figure 8, red line) is another down at the bottom of the bullish range. And last week and this will be too. Plus, we predict bullish comparisons with the rest of last Winter (blue line) and two years ago (bold line) at the bearish top. Infrastructure trends needing much more, fossil-fuel production growth pursuit down, Over There growing too, conventional energy still low, current rulers working to have it slow, + much poorly understood has conventional-energy-Bullish set up. We rate natural gas, crude oil, oil-focused E&P and Drilling & Oil Service Overweight Strong Buy; and Oil-Refining BUY.

By oilandgas360.com contributor Michael Smolinksi with Energy Directions
The views expressed in this article are solely those of the author and do not necessarily reflect the opinions of Oil & Gas 360. Please consult with a professional before making any decisions based on the information provided here. The information presented in this article is not intended as financial advice. Contact Energy Directions for the full report. Please conduct your own research before making any investment decisions.


