Back when the dinosaurs roamed the Earth in the late 1980s and 1990s, oil and gas companies started to use a term called EBITDAX instead of Net Income to describe the amount of cash that was generated from ongoing operations. Net Income includes non-cash expenses like depletion, depreciation, amortization, and interest expense.
EBITDAX?
Don’t you mean EBITDA? Actually, we mean what we mean. The “X” stands for “eXploration.” Exploration was an activity that when done well, a company would discover a 300 million barrel field offshore Sumatra Indonesia. Or a new zone called the Barnett in North Texas. You may not remember (or were even aware), but back in that time period the independents were looking for crude oil through exploration licenses in Colombia, Ecuador, Indonesia, Russia, Egypt, Algeria, and Tunisia. The Delaware Basin? Not as much “disclosure” in corporate presentations in the 90s as there is today.
Capital Efficiency Does Tell a Story of Management Efficiency
Before we move ahead, we’ll make this point clear: “In a commodity based market with a per-well profile of declining production, not rising, less is more in the oil and gas industry.” The financial wizards in OPEC didn’t learn that important and basic financial tenet in school.
Today, we use a ratio called Capital Efficiency to describe numerically how a management team is generating a $1 or more of EBITDA for every $1 of invested capital.
Capital efficiency is a metric that approximates cash flow generated for each investment dollar. Calculated as Trailing Twelve Month EBITDA divided by Trailing Twelve Month Production) divided by All-in 3-Year F&D cost per unit, the ratio provides the reader with a dollar amount to measure a management team’s operating efficiency. It tells an operating story because it excludes interest expense. Represented as a percentage, the ratio tells us that if a Capital Efficiency ratio is 202%, then company is generating $2.02 of EBITDA for every $1 of invested capital.
The period ended September 30, 2015 is the most recent period where all companies have reported their results. For the Capital Efficiency measurement, the top 10 companies (market capitalization greater than $1 billion as of February 12, 2016), on a trailing twelve month period, are:
|
Company |
Capital Efficiency Percentage | Natural Gas Reserves Percentage, 2014 |
|
| 1. | CONSOL Energy | 718% | 93% |
| 2. | National Fuel Gas | 493% | 91% |
| 3. | Antero Resources | 362% | 83% |
| 4. | Occidental Petroleum | 321% | 24% |
| 5. | EQT Corp. | 296% | 78% |
| 6. | PDC Energy | 284% | 36% |
| 7. | Range Resources | 268% | 67% |
| 8. | Continental Resources | 260% | 36% |
| 9. | EP Energy | 245% | 33% |
| 10. | Cabot Oil & Gas | 240% | 96% |
| Database Median | 108% | 42% |
Data from company reports; compiled by EnerCom Analytics
The average price for crude oil and natural gas for the measured period in the above table was $56.64 per barrel and $3.03 per Mcfe, respectively. The calculation makes no call on where the cash flow was generated or on the assets in which the capital was invested. For example, if a company invested capital on a mission critical pipeline expansion or on leasehold costs (acreage without associated reserves), capital expenses that management and the board of directors believed were important to the company’s long-term sustainability, scalability and profitability, those investment dollars are included in the All-in F&D portion of the calculation.
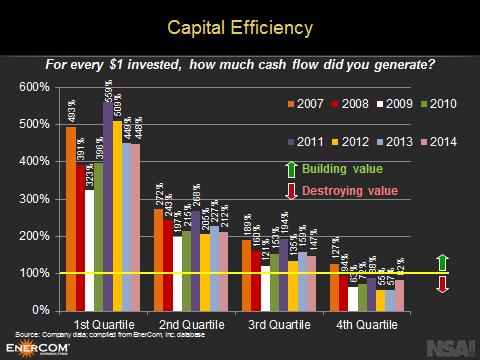
The table below presents Capital Efficiency ratios from EnerCom’s database by Quartile for the previous eight years. First Quartile is the best and Fourth Quartile isn’t. This is a table that Enercom presents annually during Netherland Sewell’s Property Evaluation Seminar in Dallas.
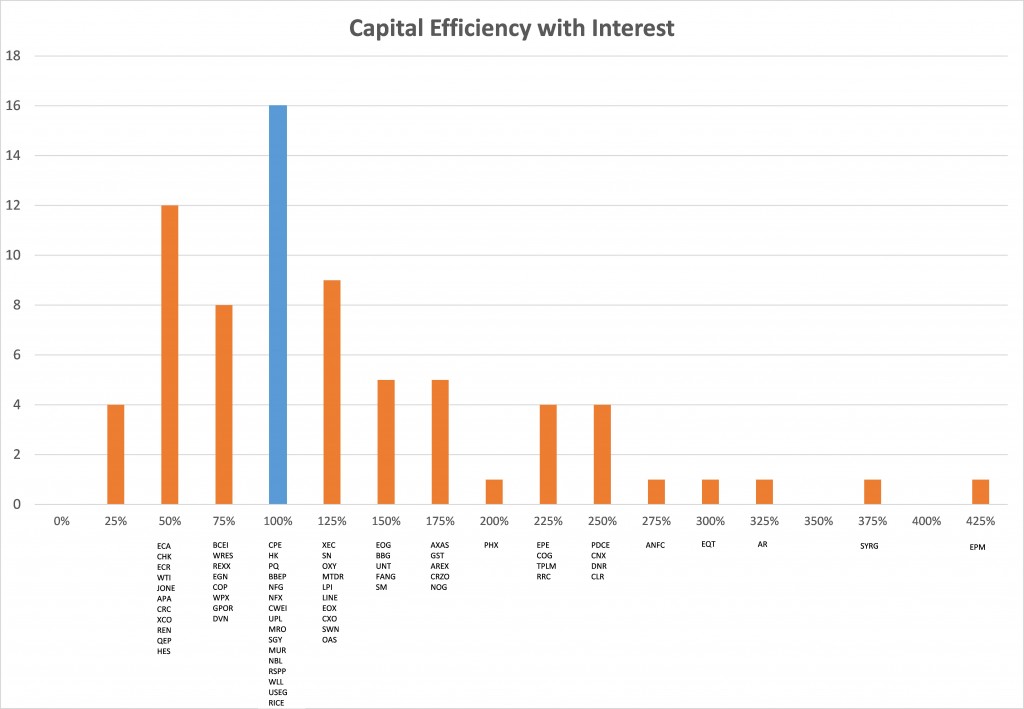
Given the current financial climate, we adjusted the calculation, adding interest expense to calculate a trailing twelve month (or annual) Cash Flow from Operations, and then dividing by a 3-year F&D per unit cost. The change is dramatic when factoring in interest expense:
|
Company |
Capital Efficiency % Without Interest Expense | Capital Efficiency % With Interest Expense |
| CONSOL Energy | 718% | 239% |
| National Fuel Gas | 493% | 81% |
| Antero Resources | 362% | 324% |
| Occidental Petroleum | 321% | 110% |
| EQT Corp. | 296% | 286% |
| PDC Energy | 284% | 237% |
| Range Resources | 268% | 225% |
| Continental Resources | 260% | 245% |
| EP Energy | 245% | 209% |
| Cabot Oil & Gas | 240% | 214% |
| Database Median | 108% | 97% |
Data from company reports; compiled by EnerCom Analytics

Looking Ahead
How do we think about Capital Efficiency going forward? How important are the company’s financial strategies for the top companies?
Oil and gas companies have hedged approximately 30% of their 2016 production at $67 per barrel and $3.65 per Mcf. The forward strip for crude oil in 2016 is $37.05 and out to December 2017 is $40.07. For natural gas, the numbers are $2.22 and $2.44, respectively. Therefore, every dollar of invested capital will be scrutinized. Financial costs, if not additive to the well site, are being addressed – common stock and preferred stock dividends are either being slashed by 50% or more, or suspended all together. A suspended dividend is an accrued dividend.
Where is the Truth?
Looking ahead, the truth is in the drillbit. It’s not about a calculated rate of return, rather it’s about cash flow and cash preservation. The median of Trailing Twelve Month (September 2015) cash margin for the large cap names was $15.66 per BOE. But this includes year-end 2014 crude oil and natural gas prices and the mini-spike in crude oil prices in the 2015 Spring, before the Iranian nuclear deal was announced on July 14, 2015. Crude oil prices for the period of July 13, 2015 and February 16, 2016 are down 44%.
Eight or so of the large cap names have reported year-end 2015 results. The cash margin for this portion of the reporting database is $10.77, or 24% down from the TTM at month-end September 2015.
Twenty-five years ago companies promoted the idea that their Debt to EBITDA would be 1.0 times or less. Today, using a Net Debt number, the average is 2.0 times. But the drilling environment is different. The U.S. horizontal drilling revolution disrupted OPEC’s hold on the global market. The suspension of the Jones Act can support exportation of American crude to foreign entities. The U.S. can use crude oil as a diplomacy tool, rather than be held hostage by outside interests whose interests are not our best interests. What this means is that the U.S. producer has a market that heretofore was not available before. It’s called the world. That’s the good news. The bad news is that if the group doesn’t survive, the market will disappear, the next administration will reverse the Jones Act decision, and the U.S. will return to importing crude oil from places where it send its sons and daughters to fight to save the oppressed from thugs and barbarians.
Cash flow is more important than ever. And freedom ain’t free.


