Uinta HZ inventory climbs to 850 net locations
Crescent Point Energy Corp. (ticker: CPG) expects to generate annual average production of 183,500 BOEPD and exit production of 195,000 BOEPD in 2018. The increase will be fueled from its $1.8 billion CapEx spending budget for 2018.
Crescent Point had a 2017 exit rate of 183,000 BOEPD, which represented year-over-year production growth of approximately 10%, both on an absolute and per share basis.
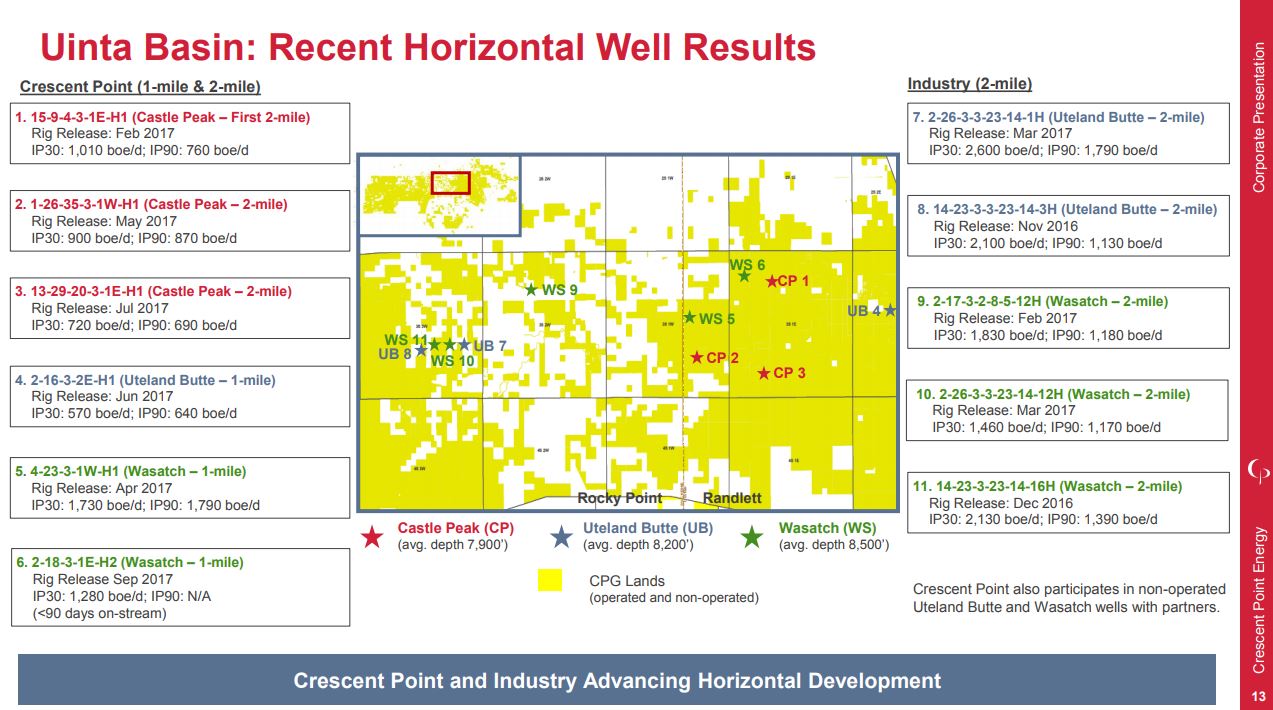
At year-end 2017, Crescent Point’s risked Uinta Basin horizontal inventory increased to approximately 850 net locations, up from 120 at the end of 2016.
According to Crescent Point, the new locations have the potential to generate more production and increase the productive capacity of drilling inventory by approximately 70%, compared to the prior year.

Crescent Points estimates Uinta basin at 8.5 billion barrels of oil in place
The company also updated its estimated original oil-in-place for the Uinta Basin, which grew by over 60% to approximately 8.5 billion barrels.
Scott Saxberg, president and CEO of Crescent Point said the Uinta locations could potentially increase to more than 1,700 based on continued success in the western portion of the basin, new zone development and additional down-spacing.

2018 budget and guidance summary
| Exit production (BOEPD) | 195,000 | ||
| Total average annual production (BOEPD) % Oil and NGLs |
183,500 90% |
||
| Capital expenditures ($ millions) Drilling and development Facilities and seismic |
$1,610 $190 |
||
| Total capital expenditures, before net land and property acquisitions ($ millions) | $1,800 | ||
| Net wells drilled | ~630 | ||
| Funds flow from operations netback based on current strip prices ($/boe) (1) (2) | ~$30.00 | ||
| Cash dividends per share in 2018 (based on current monthly dividend of $0.03 per share) | $0.36 | ||
| Total payout based on current strip prices (%) (1) (2) (3) | 99% | ||
| Net debt to funds flow from operations based on current strip prices (1) (2) (4) | 1.9x | ||
| Funds flow from operations sensitivity for every US$1.00/bbl WTI ($ millions) | ~$40 | ||
| (1) Funds flow from operations netback, total payout, net debt and net debt to funds flow from operations as presented do not have any standardized meaning prescribed by International Financial Reporting Standards (“IFRS”) and, therefore, may not be comparable with the calculation of similar measures presented by other entities. | |||
| (2) Current strip prices equate to US$60.14/bbl WTI and $0.80 US/CAD for 2018. | |||
| (3) Total payout is calculated on a percentage basis as capital expenditures and dividends declared divided by funds flow from operations. | |||
| (4) Net debt to funds flow from operations is calculated as the period end net debt divided by the sum of funds flow from operations for the trailing four quarters. | |||
| ________________________________ All financial figures are approximate and in Canadian dollars unless otherwise noted. |
|||
2018 core area summary
The following table summarizes Crescent Point’s planned core area capital allocation and expected production in 2018:
| Core Area | Capital Expenditures (% of Total) |
Annual Average Production (BOEPD) |
Exit-to-Exit Growth (%) |
Net Wells (# of Locations) |
||
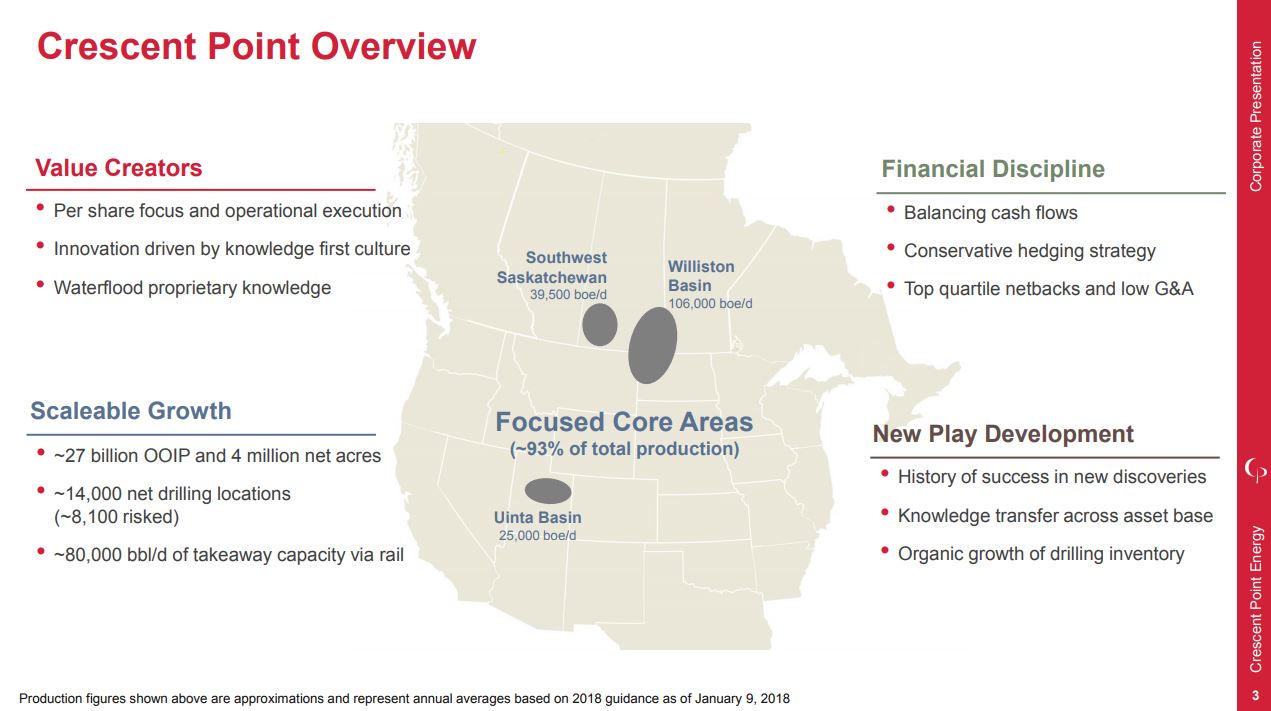
| Williston Basin | 55 | % | 106,000 | 7 | % | 370 |
| Southwest Saskatchewan | 20 | % | 39,500 | 4 | % | 210 |
| Uinta Basin | 20 | % | 25,000 | 15 | % | 30 |
| Figures shown above are approximations. | ||||||
“Our Williston Basin and southwest Saskatchewan areas continue to generate free cash flow and support our growth strategy in the Uinta basin,” Saxberg said. “Our 2018 focus in Uinta will include two-mile horizontal wells, multi-well pad drilling for improved efficiencies, new zone development and further delineation on the western portion of the basin.”
Waterflood CapEx
Throughout 2017, Crescent Point advanced its Injection Control Device (ICD) waterflood systems, which resulted in improved water injectivity and production rates. According to Crescent Point, within the Bakken waterflood in the Williston Basin, ICDs doubled water injectivity and increased oil production by approximately 25%.
In 2018, Crescent Point is targeting total waterflood capital expenditures of approximately $35 million, an amount similar to the prior year. The company’s 2018 budget also includes investments in climate change initiatives as well as additional remote field monitoring and automation pilots to further improve efficiencies.
Rebalancing; may sell larger non-core assets
During fourth quarter 2017, Crescent Point had additional non-core asset dispositions for a total value of approximately $40 million, of which approximately $20 million are expected to close in first quarter 2018. These transactions are in addition to the $280 million of previously announced 2017 dispositions.
“In 2017, we captured over 400,000 net acres in our core areas that provide three times the potential upside relative to the non-core assets we disposed throughout the year,” said Saxberg. “These transactions provide us with significant future production, reserves and inventory growth potential. We are currently marketing non-core asset packages and may also look to sell larger non-core assets to further strengthen our balance sheet, should market conditions allow.”


