Success in the Codell sandstone: Wyoming Geological Survey examines 119 producing Codell horizontal oil wells in Laramie County

The Codell sandstone could be a formation that operators might begin to take seriously. A new report from the State of Wyoming Geological Survey (WSGS) looks at data from 119 horizontal wells owned by six operators that have produced oil from the Codell sandstone in the northern Denver Basin in Southern Wyoming, between 2012 and March of 2017.
The study, “Codell Sandstone Oil Production Trends, Northern Denver Basin, Laramie County, Wyoming,” examines characteristics associated with the highest-producing wells in an approximately 640-square-mile study area east of Cheyenne.

According to the WSGS report, the sandstone is relatively thin, averaging 20–30 feet through most of the basin, and the Codell has historically been considered uneconomical to produce given its low porosity and permeability.
But given the shale industry’s effect on how wells targeting tight formations are now drilled and completed, repeating the formula for success used in other formations could work out well for the Codell play in Laramie County, Wyoming.
WSGS report looks in detail at completion techniques that generated the highest Codell production
| API number | Company | Number of stages | Total slurry (bbl) | Total proppant (lb) | Lateral length (ft) |
| 49-021-20877 | EOG Resources Inc | 15 | 72,062 | 3,091,080 | 4270 |
| 49-021-20888 | Kaiser Francis Oil Co | 18 | 58,940 | 2,695,050 | 4691 |
| 49-021-20966 | Kaiser Francis Oil Co | 15 | 39,023 | 2,538,000 | 5110 |
| 49-021-20967 | EOG Resources Inc | 3,192,026 | 3,021,660 | 9957 | |
| 49-021-20976 | EOG Resources Inc | 18 | 30,648 | 3,382,180 | 4692 |
| 49-021-20983 | Samson Exploration LLC | 19 | 5,262 | 185,600 | 3888 |
| 49-021-21002 | Samson Exploration LLC | 18 | 58,987 | 3,367,628 | 4450 |
| 49-021-21004 | Samson Exploration LLC | 19 | 65,436 | 3,538,750 | 4172 |
| 49-021-21006 | Kaiser Francis Oil Co | 37 | 4,621,509 | 4,405,763 | 10450 |
| 49-021-21007 | Kaiser Francis Oil Co | 37 | 3,101,697 | 3,163,547 | 8937 |
| 49-021-21012 | EOG Resources Inc | 47 | 358,218 | 17,461,875 | 9570 |
| 49-021-21013 | Kaiser Francis Oil Co | 40 | 5,362,558 | 6,023,541 | 9935 |
| 49-021-21014 | Kaiser Francis Oil Co | 40 | 5,417,399 | 5,906,658 | 10099 |
| 49-021-21015 | EOG Resources Inc | 45 | 448,134 | 16,738,048 | 10095 |
| 49-021-21018 | Samson Exploration LLC | 18 | 69,064 | 4,701,689 | 4651 |
| 49-021-21026 | EOG Resources Inc | 52 | 197,002 | 11,861,901 | 9759 |
| 49-021-21027 | EOG Resources Inc | 55 | 219,455 | 12,601,470 | 10271 |
| 49-021-21028 | Kaiser Francis Oil Co | 40 | 3,618,179 | 4,011,214 | 10311 |
| 49-021-21030 | Kaiser Francis Oil Co | 40 | 93,000 | 4,193,625 | 9916 |
| 49-021-21050 | HRM Resources II LLC | 18 | 53,266 | 4,090,720 | 4562 |
| 49-021-21052 | HRM Resources II LLC | 18 | 55,844 | 4,074,869 | 4548 |
| 49-021-21053 | HRM Resources II LLC | 18 | 20,417 | 3,968,780 | 4639 |
| 49-021-21054 | HRM Resources II LLC | 18 | 53,266 | 4,090,720 | 4656 |
| 49-021-21055 | Samson Exploration LLC | 29 | 96,787 | 6,900,188 | 6720 |
| 49-021-21056 | EOG Resources Inc | 47 | 157,833 | 3,903,158 | 10363 |
| 49-021-21057 | EOG Resources Inc | 44 | 190,172 | 11,785,276 | 9539 |
| 49-021-21060 | EOG Resources Inc | 52 | 377,380 | 10,987,347 | 10244 |
| 49-021-21061 | EOG Resources Inc | 53 | 355,025 | 10,725,156 | 10231 |
| 49-021-21064 | EOG Resources Inc | 43 | 192,653 | 12,117,210 | 10221 |
| 49-021-21065 | Samson Exploration LLC | 33 | 109,983 | 7,885,912 | 7618 |
| 49-021-21066 | Samson Exploration LLC | 33 | 106,940 | 7,586,097 | 7569 |
| 49-021-21079 | EOG Resources Inc | 47 | 237,526 | 16,982,644 | 9625 |
| 49-021-21081 | EOG Resources Inc | 45 | 186,324 | 13,640,780 | 10291 |
| 49-021-21083 | EOG Resources Inc | 54 | 202,010 | 12,208,647 | 10286 |
| 49-021-21084 | EOG Resources Inc | 54 | 204,085 | 11,920,298 | 10209 |
| 49-021-21085 | EOG Resources Inc | 54 | 197,014 | 12,208,647 | 10224 |
| 49-021-21088 | EOG Resources Inc | 51 | 342,496 | 9,960,068 | 9608 |
| 49-021-21090 | EOG Resources Inc | 48 | 178,701 | 10,850,710 | 9598 |
| 49-021-21093 | EOG Resources Inc | 47 | 219,351 | 14,516,807 | 10293 |
| 49-021-21098 | EOG Resources Inc | 44 | 194,123 | 13,302,469 | 9696 |
| 49-021-21101 | EOG Resources Inc | 45 | 206,012 | 14,084,730 | 10269 |
| 49-021-21102 | EOG Resources Inc | 40 | 179,720 | 12,354,370 | 10027 |
| 49-021-21109 | EOG Resources Inc | 45 | 193,436 | 14,048,830 | 10042 |
| 49-021-21112 | Kaiser Francis Oil Co | 20 | 64,273 | 3,116,608 | 5272 |
| 49-021-21117 | Kaiser Francis Oil Co | 40 | 130,091 | 6,204,780 | 10204 |
| 49-021-21118 | Kaiser Francis Oil Co | 41 | 132,358 | 6,297,964 | 10527 |
| 49-021-21128 | EOG Resources Inc | 51 | 298,014 | 12,503,840 | 9472 |
| 49-021-21129 | Samson Exploration LLC | 33 | 111,244 | 7,714,200 | 7401 |
| 49-021-21131 | EOG Resources Inc | 55 | 206,082 | 12,496,397 | 9831 |
| 49-021-21132 | Kaiser Francis Oil Co | 50 | 131,402 | 6,050,372 | 9979 |
| 49-021-21133 | Kaiser Francis Oil Co | 50 | 129,983 | 6,031,154 | 10444 |
| 49-021-21135 | Samson Exploration LLC | 45 | 152,020 | 9,421,983 | 9852 |
| 49-021-21136 | Samson Exploration LLC | 33 | 104,317 | 7,548,585 | 7536 |
| 49-021-21140 | EOG Resources Inc | 43 | 320,882 | 21,388,720 | 9516 |
| 49-021-21143 | EOG Resources Inc | 55 | 201,784 | 12,571,360 | 10268 |
| 49-021-21146 | Samson Exploration LLC | 35 | 107,442 | 7,833,550 | 7226 |
| 49-021-21164 | Kaiser Francis Oil Co | 50 | 128,988 | 5,709,631 | 10456 |
| 49-021-21166 | EOG Resources Inc | 45 | 182,491 | 13,612,210 | 9708 |
| 49-021-21170 | EOG Resources Inc | 45 | 184,100 | 13,698,745 | 10343 |
| 49-021-21173 | EOG Resources Inc | 41 | 180,169 | 12,469,370 | 9343 |
| 49-021-21176 | Longs Peak Resources LLC | 20 | 67,530 | 5,022,950 | 4779 |
| 49-021-21178 | EOG Resources Inc | 45 | 195,033 | 12,286,229 | 9646 |
| 49-021-21180 | EOG Resources Inc | 47 | 203,310 | 12,700,600 | 10272 |
| 49-021-21181 | EOG Resources Inc | 36 | 250,538 | 17,815,080 | 9419 |
| 49-021-21182 | EOG Resources Inc | 47 | 200,107 | 12,078,150 | 9575 |
| 49-021-21184 | EOG Resources Inc | 43 | 165,100 | 11,093,890 | 9563 |
| 49-021-21203 | EOG Resources Inc | 45 | 206,730 | 12,677,630 | 10259 |
| 49-021-21226 | EOG Resources Inc | 53 | 198,308 | 12,175,032 | 10271 |
| 49-021-21227 | EOG Resources Inc | 55 | 207,219 | 12,562,440 | 10315 |
| 49-021-21228 | EOG Resources Inc | 55 | 206,078 | 10,272,721 | 10248 |
| 49-021-21246 | EOG Resources Inc | 44 | 312,918 | 21,833,980 | 9461 |
| 49-021-21247 | EOG Resources Inc | 43 | 322,764 | 20,914,530 | 9311 |
| 49-021-21249 | EOG Resources Inc | 43 | 311,524 | 20,966,440 | 10250 |
| 49-021-21254 | EOG Resources Inc | 37 | 198,330 | 13,460,618 | 10081 |
| 49-021-21291 | EOG Resources Inc | 45 | 178,743 | 12,477,260 | 9712 |
| 49-021-21292 | EOG Resources Inc | 40 | 147,849 | 10,113,680 | 9608 |
| 49-021-21293 | EOG Resources Inc | 40 | 182,266 | 12,463,714 | 10085 |
| 49-021-21294 | EOG Resources Inc | 46 | 189,887 | 13,850,275 | 9644 |
| 49-021-21361 | EOG Resources Inc | 45 | 186,324 | 9,013,586 | 10476 |
| 49-021-21362 | Kaiser Francis Oil Co | 40 | 131,192 | 5,555,958 | 10479 |
| 49-021-21398 | Kaiser Francis Oil Co | 40 | 143,590 | 5,122,530 | 10582 |
| 49-021-21399 | Kaiser Francis Oil Co | 50 | 125,661 | 5,704,743 | 10554 |
| 49-021-21400 | Kaiser Francis Oil Co | 20 | 61,322 | 2,831,668 | 5311 |
| 49-021-21414 | EOG Resources Inc | 43 | 177,951 | 12,978,920 | 9643 |
| 49-021-21436 | EOG Resources Inc | 44 | 183,860 | 13,333,715 | 9640 |
| 49-021-21453 | EOG Resources Inc | 43 | 175,050 | 12,135,551 | 9703 |
| 49-021-21520 | Kaiser Francis Oil Co | 51 | 127,898 | 5,569,048 | 10085 |
| 49-021-21521 | Kaiser Francis Oil Co | 51 | 123,898 | 5,447,363 | 10476 |
| 49-021-21522 | Kaiser Francis Oil Co | 51 | 145,356 | 5,926,709 | 10475 |
| 49-021-21543 | Kaiser Francis Oil Co | 50 | 131,581 | 5,913,074 | 9949 |
| 49-021-21558 | EOG Resources Inc | 45 | 194,377 | 13,769,888 | 10079 |
| 49-021-21569 | Ward Petroleum Corporation | 56 | 193,715 | 13,052,294 | 9860 |
| 49-021-21570 | Ward Petroleum Corporation | 52 | 206,366 | 10,744,766 | 10428 |
| 49-021-21591 | Kaiser Francis Oil Co | 51 | 129,154 | 5,351,348 | 10039 |
| 49-021-21592 | Kaiser Francis Oil Co | 51 | 128,636 | 5,720,908 | 9953 |
| 49-021-21614 | Kaiser Francis Oil Co | 50 | 122,996 | 6,068,543 | 10632 |
| 49-021-21789 | Kaiser Francis Oil Co | 60 | 129,195 | 5,759,892 | 9696 |
| 49-021-21948 | Ward Petroleum Corporation | 55 | 205,522 | 12,785,434 | 10567 |
| 49-021-22144 | Kaiser Francis Oil Co | 50 | 145,104 | 6,085,883 | 10897 |
| 49-021-22145 | Kaiser Francis Oil Co | 50 | 124,887 | 6,090,476 | 9599 |
| 49-021-22269 | Kaiser Francis Oil Co | 51 | 127,142 | 5,751,915 | 10666 |
| 49-021-22270 | Kaiser Francis Oil Co | 50 | 123,367 | 5,997,984 | 9752 |
| 49-021-22271 | Kaiser Francis Oil Co | 50 | 122,617 | 6,093,046 | 9789 |
| 49-021-22272 | Kaiser Francis Oil Co | 24 | 55,142 | 2,813,022 | 5279 |
| 49-021-22275 | Kaiser Francis Oil Co | 40 | 114,911 | 1,696,859 | 10556 |
| 49-021-22294 | EOG Resources Inc | 57 | 355,505 | 25,680,450 | 10446 |
| 49-021-22295 | EOG Resources Inc | 52 | 349,459 | 23,376,901 | 10326 |
| 49-021-22298 | EOG Resources Inc | 42 | 269,057 | 18,339,206 | 9521 |
| 49-021-22303 | EOG Resources Inc | 46 | 324,225 | 20,531,200 | 9605 |
| 49-021-22651 | Samson Exploration LLC | 52 | 308,498 | 18,542,092 | 10341 |
| 49-021-22652 | Samson Exploration LLC | 52 | 279,223 | 18,543,855 | 10269 |
| 49-021-22656 | Kaiser Francis Oil Co | 50 | 122,081 | 5,766,372 | 9976 |
| 49-021-22657 | Kaiser Francis Oil Co | 23 | 50,693 | 2,711,953 | 5324 |
| 49-021-22788 | Kaiser Francis Oil Co | 50 | 121,909 | 6,037,152 | 10021 |
| 49-021-22789 | Kaiser Francis Oil Co | 30 | 70,751 | 3,629,948 | 5907 |
| 49-021-23042 | Kaiser Francis Oil Co | 51 | 118,753 | 5,671,315 | 9985 |
| 49-021-23870 | Samson Exploration LLC | 55 | 322,829 | 19,622,283 | 10691 |
| 49-021-23871 | Samson Exploration LLC | 55 | 327,633 | 19,462,453 | 10742 |
| 49-021-23872 | Samson Exploration LLC | 55 | 291,926 | 19,593,654 | 10688 |
According to the WSGS, “cross-plots comparing number of frac stages and amounts of proppant and slurry to early and cumulative production indicate that the best wells were completed with at least 40 frac stages, 200,000 bbls of slurry, and between 10 million and 12.5 million pounds of proppant. They also establish that for all three completion factors, there reaches a point of diminishing economic returns beyond which operators may not see a corresponding payoff in production.”

“As operators expand into more areas of the basin, they will continue to test the hypothesis that where a Codell Sandstone well is drilled is less important than how it is drilled,” the authors said.
Initial production and well completion data, including the number of hydraulic fracturing stages, total slurry volume and the total amount of material used to keep an induced hydraulic fracture open during or after a fracturing treatment (proppant), were researched from well completion reports.
The report calculates cumulative oil production from the Codell sandstone for all wells, along with each well’s first 3, 6, 9, 12 and 18 months of production.


Initial Codell production per well
| API number | IP oil (bbl) | IP oil API gravity | IP GOR | First year produced | Reservoir |
| 49-021-20877 | 455 | 604 | 2012 | Codell Sand | |
| 49-021-20888 | 10 | 40.0 | 2014 | Codell Sand | |
| 49-021-20966 | 189 | 34.0 | 614 | 2012 | Codell Sand |
| 49-021-20967 | 357 | 36.5 | 994 | 2013 | Codell Sand |
| 49-021-20976 | 468 | 2013 | Codell Sand | ||
| 49-021-20983 | 767 | 38.0 | 307 | 2013 | Codell Sand |
| 49-021-21002 | 507 | 37.0 | 590 | 2013 | Codell Sand |
| 49-021-21004 | 230 | 37.0 | 257 | 2013 | Codell Sand |
| 49-021-21006 | 595 | 34.0 | 509 | 2013 | Codell Sand |
| 49-021-21007 | 460 | 34.0 | 439 | 2013 | Codell Sand |
| 49-021-21012 | 944 | 2013 | Codell Sand | ||
| 49-021-21013 | 227 | 40.0 | 727 | 2014 | Codell Sand |
| 49-021-21014 | 319 | 40.0 | 1555 | 2014 | Codell Sand |
| 49-021-21015 | 376 | 2013 | Codell Sand | ||
| 49-021-21018 | 309 | 36.0 | 530 | 2014 | Codell Sand |
| 49-021-21026 | 991 | 2014 | Codell Sand | ||
| 49-021-21027 | 896 | 2014 | Codell Sand | ||
| 49-021-21028 | 501 | 40.0 | 34 | 2014 | Codell Sand |
| 49-021-21030 | 240 | 40.0 | 775 | 2014 | Codell Sand |
| 49-021-21050 | 298 | 38.0 | 656 | 2014 | Codell Sand |
| 49-021-21052 | 274 | 0.4 | 617 | 2014 | Codell Sand |
| 49-021-21053 | 194 | 345 | 2014 | Codell Sand | |
| 49-021-21054 | 95 | 737 | 2014 | Codell Sand | |
| 49-021-21055 | 609 | 327 | 2014 | Codell Sand | |
| 49-021-21056 | 219 | 2014 | Codell Sand | ||
| 49-021-21057 | 956 | 2015 | Codell Sand | ||
| 49-021-21060 | 684 | 2014 | Codell Sand | ||
| 49-021-21061 | 1216 | 2014 | Codell Sand | ||
| 49-021-21064 | 674 | 2015 | Codell Sand | ||
| 49-021-21065 | 719 | 321 | 2014 | Codell Sand | |
| 49-021-21066 | 963 | 36.0 | 341 | 2014 | Codell Sand |
| 49-021-21079 | 923 | 35.0 | 532 | 2015 | Codell Sand |
| 49-021-21081 | 466 | 36.5 | 359 | 2016 | Codell Sand |
| 49-021-21083 | 892 | 2014 | Codell Sand | ||
| 49-021-21084 | 1386 | 2014 | Codell Sand | ||
| 49-021-21085 | 1090 | 2014 | Codell Sand | ||
| 49-021-21088 | 886 | 2014 | Codell Sand | ||
| 49-021-21090 | 867 | 2014 | Codell Sand | ||
| 49-021-21093 | 638 | 36.5 | 826 | 2016 | Codell Sand |
| 49-021-21098 | 507 | 36.5 | 485 | 2016 | Codell Sand |
| 49-021-21101 | 687 | 36.0 | 498 | 2016 | Codell Sand |
| 49-021-21102 | 628 | 36.0 | 618 | 2016 | Codell Sand |
| 49-021-21109 | 688 | 36.0 | 624 | 2016 | Codell Sand |
| 49-021-21112 | 420 | 40.0 | 550 | 2014 | Codell Sand |
| 49-021-21117 | 1086 | 40.0 | 531 | 2014 | Codell Sand |
| 49-021-21118 | 808 | 40.0 | 296 | 2014 | Codell Sand |
| 49-021-21128 | 1089 | 2014 | Codell Sand | ||
| 49-021-21129 | 608 | 432 | 2014 | Codell Sand | |
| 49-021-21131 | 1046 | 2014 | Codell Sand | ||
| 49-021-21132 | 165 | 40.0 | 630 | 2015 | Codell Sand |
| 49-021-21133 | 314 | 40.0 | 341 | 2015 | Codell Sand |
| 49-021-21135 | 1145 | 639 | 2014 | Codell Sand | |
| 49-021-21136 | 702 | 732 | 2014 | Codell Sand | |
| 49-021-21140 | 602 | 36.4 | 726 | 2015 | Codell Sand |
| 49-021-21143 | 1105 | 2014 | Codell Sand | ||
| 49-021-21146 | 630 | 344 | 2014 | Codell Sand | |
| 49-021-21164 | 351 | 40.0 | 430 | 2014 | Codell Sand |
| 49-021-21166 | 424 | 36.5 | 603 | 2016 | Codell Sand |
| 49-021-21170 | 1194 | 35.2 | 590 | 2016 | Codell Sand |
| 49-021-21173 | 1333 | 35.2 | 573 | 2016 | Codell Sand |
| 49-021-21176 | 392 | 501 | 2014 | Codell Sand | |
| 49-021-21178 | 1003 | 36.2 | 219 | 2014 | Codell Sand |
| 49-021-21180 | 721 | 36.6 | 418 | 2014 | Codell Sand |
| 49-021-21181 | 791 | 34.2 | 631 | 2015 | Codell Sand |
| 49-021-21182 | 752 | 2015 | Codell Sand | ||
| 49-021-21184 | 474 | 34.2 | 722 | 2016 | Codell Sand |
| 49-021-21203 | 960 | 2014 | Codell Sand | ||
| 49-021-21226 | 823 | 2014 | Codell Sand | ||
| 49-021-21227 | 1239 | 2014 | Codell Sand | ||
| 49-021-21228 | 1219 | 2014 | Codell Sand | ||
| 49-021-21246 | 575 | 36.1 | 683 | 2015 | Codell Sand |
| 49-021-21247 | 937 | 34.6 | 648 | 2015 | Codell Sand |
| 49-021-21249 | 1078 | 34.2 | 647 | 2015 | Codell Sand |
| 49-021-21254 | 1277 | 35.8 | 634 | 2016 | Codell Sand |
| 49-021-21291 | 452 | 34.2 | 754 | 2016 | Codell Sand |
| 49-021-21292 | 457 | 34.2 | 650 | 2016 | Codell Sand |
| 49-021-21293 | 361 | 36.5 | 543 | 2016 | Codell Sand |
| 49-021-21294 | 522 | 36.0 | 571 | 2016 | Codell Sand |
| 49-021-21361 | 640 | 35.8 | 619 | 2017 | Codell Sand |
| 49-021-21362 | 291 | 40.0 | 564 | 2014 | Codell Sand |
| 49-021-21398 | 327 | 40.0 | 446 | 2014 | Codell Sand |
| 49-021-21399 | 457 | 40.0 | 230 | 2014 | Codell Sand |
| 49-021-21400 | 15 | 40.0 | 5000 | 2014 | Codell Sand |
| 49-021-21414 | 550 | 36.0 | 527 | 2016 | Codell Sand |
| 49-021-21436 | 543 | 36.0 | 632 | 2016 | Codell Sand |
| 49-021-21453 | 706 | 34.2 | 752 | 2016 | Codell Sand |
| 49-021-21520 | 170 | 40.0 | 306 | 2016 | Codell Sand |
| 49-021-21521 | 182 | 40.0 | 478 | 2015 | Codell Sand |
| 49-021-21522 | 187 | 40.0 | 540 | 2015 | Codell Sand |
| 49-021-21543 | 84 | 40.0 | 655 | 2015 | Codell Sand |
| 49-021-21558 | 796 | 36.5 | 603 | 2016 | Codell Sand |
| 49-021-21569 | 516 | 36.0 | 233 | 2015 | Codell Sand |
| 49-021-21570 | 241 | 36.0 | 451 | 2015 | Codell Sand |
| 49-021-21591 | 215 | 40.0 | 363 | 2015 | Codell Sand |
| 49-021-21592 | 219 | 40.0 | 388 | 2015 | Codell Sand |
| 49-021-21614 | 140 | 40.0 | 500 | 2015 | Codell Sand |
| 49-021-21789 | 117 | 40.0 | 453 | 2015 | Codell Sand |
| 49-021-21948 | 561 | 37.0 | 421 | 2015 | Codell Sand |
| 49-021-22144 | 249 | 40.0 | 229 | 2015 | Codell Sand |
| 49-021-22145 | 375 | 40.0 | 515 | 2015 | Codell Sand |
| 49-021-22269 | 127 | 40.0 | 953 | 2015 | Codell Sand |
| 49-021-22270 | 130 | 40.0 | 954 | 2015 | Codell Sand |
| 49-021-22271 | 320 | 40.0 | 672 | 2015 | Codell Sand |
| 49-021-22272 | 159 | 40.0 | 604 | 2015 | Codell Sand |
| 49-021-22275 | 207 | 40.0 | 411 | 2015 | Codell Sand |
| 49-021-22294 | 1191 | 35.1 | 468 | 2015 | Codell Sand |
| 49-021-22295 | 743 | 35.2 | 579 | 2015 | Codell Sand |
| 49-021-22298 | 1043 | 34.3 | 545 | 2015 | Codell Sand |
| 49-021-22303 | 1036 | 37.4 | 562 | 2015 | Codell Sand |
| 49-021-22651 | 944 | 35.4 | 540 | 2016 | Codell Sand |
| 49-021-22652 | 696 | 35.4 | 589 | 2016 | Codell Sand |
| 49-021-22656 | 120 | 40.0 | 483 | 2015 | Codell Sand |
| 49-021-22657 | 73 | 40.0 | 849 | 2015 | Codell Sand |
| 49-021-22788 | 137 | 40.0 | 350 | 2015 | Codell Sand |
| 49-021-22789 | 120 | 40.0 | 417 | 2015 | Codell Sand |
| 49-021-23042 | 117 | 40.0 | 410 | 2015 | Codell Sand |
| 49-021-23870 | 888 | 35.2 | 551 | 2016 | Codell Sand |
| 49-021-23871 | 1192 | 35.2 | 688 | 2016 | Codell Sand |
| 49-021-23872 | 828 | 35.2 | 628 | 2016 | Codell Sand |
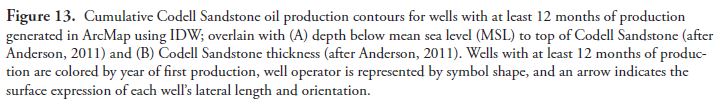
“The comparisons show that while traditional geologic criteria such as thickness and formation depth do not primarily influence production from the Codell Sandstone in the study area, wells with long laterals oriented north-south have consistently greater production than those drilled to shorter lengths and alternate directions,” said WSGS oil and gas geologist and project lead, Rachel Toner.
The study is an open file report and therefore will be supplemented periodically as new information becomes available.
WSGS analyzing Powder River basin next
“The WSGS is performing similar analyses on additional unconventional plays in the Powder River and northern Denver basins to determine the influence that completion techniques and geology have on production,” said Toner.
The 40-page report is accompanied by an Excel spreadsheet containing all well drilling, completion and production data used in the study. The report, authored by Toner and WSGS geologist Dr. Erin Campbell, is available as a free download.