The CIBC maintains a bearish outlook on gas prices as weather remains warmer than last year
The Canadian Imperial Bank of Commerce (CIBC) released its outlook on gas today, continuing to hold its bearish stance on the commodity’s future. The major factor determining the future price and inventories of gas, according to CIBC, is the weather. With the incredibly cold winter seen across the United States last year causing an abnormally high spike in gas demand, many were hoping for similar weather again this year.
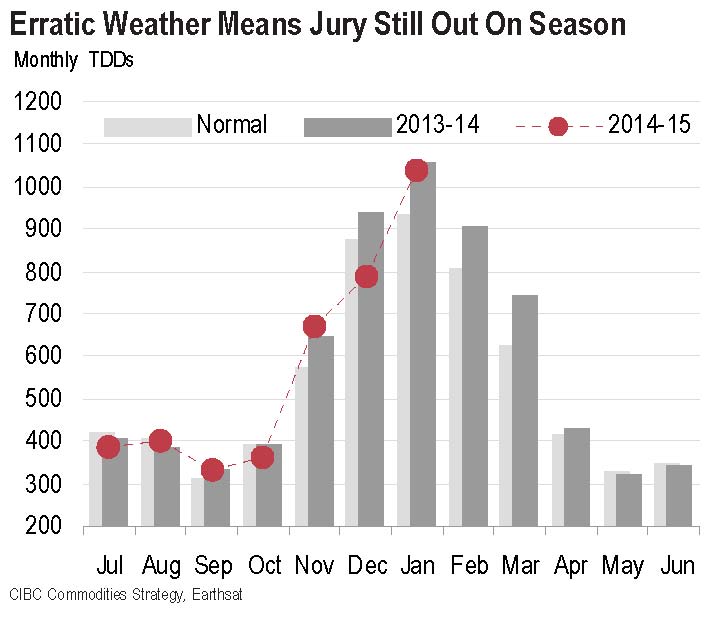
Of course, the weather is never easy to predict, and so far has not left the entire U.S. running for their fireplaces and thermostats like it did last year. While the potential for more cold weather this winter could help bring on a more bullish gas market, CIBC says consumers came in to the season defensively, remembering the extreme cold of last year, setting the market up for disappoint this winter, regardless of the temperature.
Main points of CIBC’s “Natural Gas View”
- This winter underscores the view that North American gas is structurally weak; while it is still susceptible to weather-driven price spikes in any given winter — particularly in key basis markets — it is pretty clear that those spikes reflect a shortage of deliverability during peak demand periods, not a shortage of supply. And when the weather doesn’t materialize… neither do the spikes.• We believe that annualized Henry Hub prices will range between $2.75-$4.25 in the medium-term, and whether they fall towards the higher or lower end of that range will depend largely on weather. We see prices averaging $3.25/MMBtu this year, and $3.75 in 2016.• So far this winter has been a mixed bag weather-wise. But the memory of last winter’s extreme cold inspired consumers to approach this season with a far more defensive posture, effectively setting the market up for disappointment even if the early cold observed in November had been consistent throughout the season. Many hedged as much or more gas volume this year than they did last (either on a physical or financial basis), which, from the get go, made this year different.

• As early as last May — when gas storage was still below five-year lows — we expected that storage would rebuild rapidly to end the 2014-15 withdrawal season as high at 1.7 Tcf — a bit above average — even assuming normal weather in the subsequent summer and winter. Weather forecasts reflect at least two more weeks of colder-than-normal temperatures across the upper half of North America, and we can’t rule out another two months of unusual cold. But short of that we now think that 1.85 Tcf is a more likely end-March level.
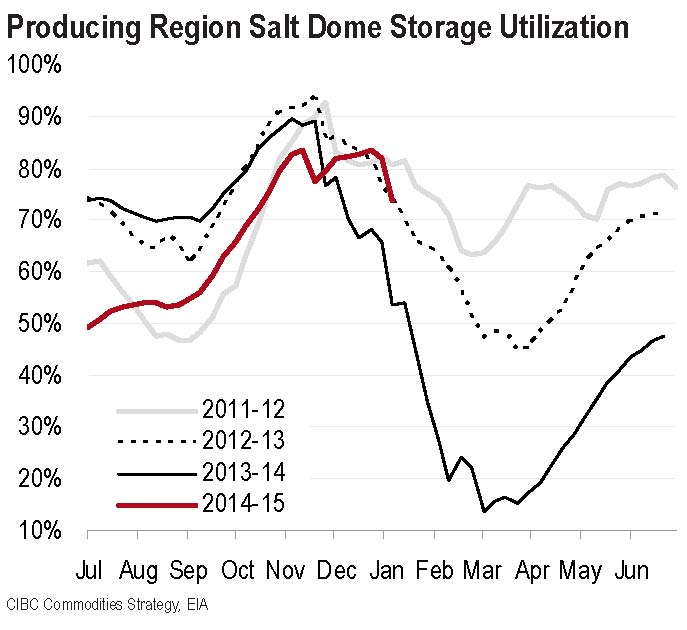
• Similarly, producing region salt dome storage utilization is currently near historical highs on an outright basis, but in between what we saw in the 2011-12 season and in the 2012-13 season on a percentage utilization basis.

- If we think of the 2011-12 and 2012-13 seasons as bounds for the potential price outcomes this year, flat price looks about right. More out of place is the March-April spread, or injection season spreads more generally.• If we do not see consistent cold for the balance of the season, a sub-$2.50 Henry Hub price heading into summer is a strong possibility. Basis pricing in the Marcellus is already under more pressure than we would expect — statistically — at this Henry Hub level. This is not a bullish sign for gas prices coming out of the winter.
• Coal-gas switching economics are still a great indicator of Henry Hub’s medium-term range, and short-term ceilings and floors. Back in 2012 NYMEX Henry Hub found its floor at $1.91 in April and didn’t stay there long. Demand creation —specifically, coal to gas switching — gave gas its price floor, and did so pretty quickly. This year, the gas balance looks very sloppy without a significant uptick in power generation demand for gas, which means gas will have to price accordingly.
• On the supply side, 2016 is when we would expect to see a more pronounced supply response to lower prices, if low oil prices persist for at least six months. Associated gas makes up about 18% of total US gas production. Of that, the Eagleford and the Bakken plays have contributed about 2 Bcf/day of gas production growth over the past six months, compared to 5.5 Bcf/day nationally.
• Given the deterioration of the “liquids subsidy” — i.e. the premium that producers of wet gas receive for the liquids component of their production, relative to the dry gas component — we can’t rule out a shift back towards investment in dry gas production.
Important disclosures: The information provided herein is believed to be reliable; however, EnerCom, Inc. makes no representation or warranty as to its completeness or accuracy. EnerCom’s conclusions are based upon information gathered from sources deemed to be reliable. This note is not intended as an offer or solicitation for the purchase or sale of any security or financial instrument of any company mentioned in this note. This note was prepared for general circulation and does not provide investment recommendations specific to individual investors. All readers of the note must make their own investment decisions based upon their specific investment objectives and financial situation utilizing their own financial advisors as they deem necessary. Investors should consider a company’s entire financial and operational structure in making any investment decisions. Past performance of any company discussed in this note should not be taken as an indication or guarantee of future results. EnerCom is a multi-disciplined management consulting services firm that regularly intends to seek business, or currently may be undertaking business, with companies covered on Oil & Gas 360®, and thereby seeks to receive compensation from these companies for its services. In addition, EnerCom, or its principals or employees, may have an economic interest in any of these companies. As a result, readers of EnerCom’s Oil & Gas 360® should be aware that the firm may have a conflict of interest that could affect the objectivity of this note. The company or companies covered in this note did not review the note prior to publication. EnerCom, or its principals or employees, may have an economic interest in any of the companies covered in this report or on Oil & Gas 360®. As a result, readers of EnerCom’s reports or Oil & Gas 360® should be aware that the firm may have a conflict of interest that could affect the objectivity of this report.


