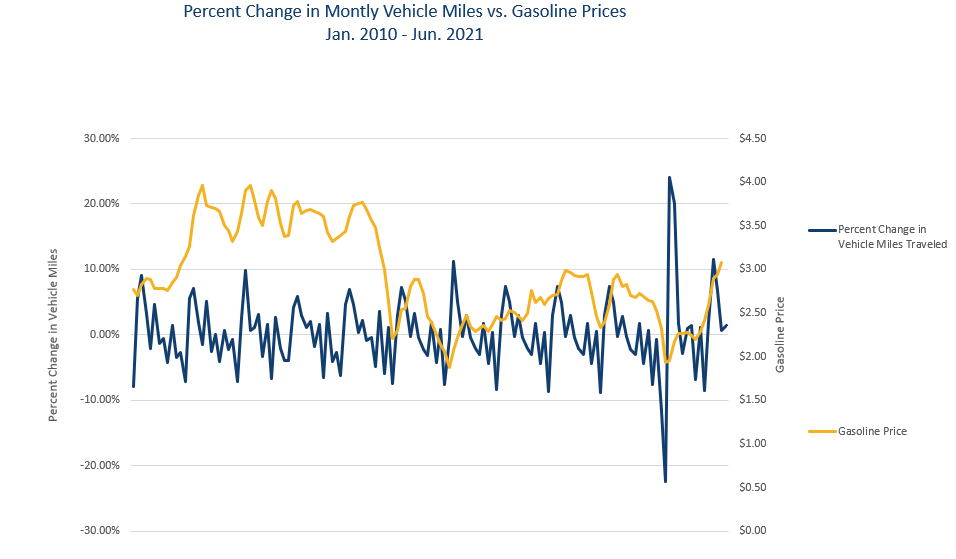
The Energy Information Administration (EIA) reports the number of miles traveled by vehicles which is a great indication of demand for hydrocarbons. On a monthly basis, the number of vehicle miles traveled increased in the first half of the year (January to June) and decreased during the second half of the year. Each year, vehicle miles increased by an average of 1% from 2000 to 2019. COVID-19 caused this number to drop greatly and from January 2020 to April 2020 leaving a 32% decrease during a time when vehicle miles would normally be rising. Over the next two months, from April 2020 to June 2020, there was an increase of 33% to make up for this. This brought demand back up to peak levels last seen in June 2002. Vehicle miles traveled continued to increase until November 2020 where vehicle miles traveled fell again. However, this fall can be attributed to the normal cycle of driving seasons as the percent decrease is similar to the normal decrease at this time of year in past years. Overall, for 2020 vehicle miles decreased by 13% but increased in 2021 by 10% to try to make up for the lost productivity during the start of the COVID-19 pandemic.


