Tuesday, April 1, 2025

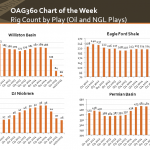
United States Rig Count Approaching 800 Following Largest Drop since April

Oil Rigs Reach New Five-Year Low A few months ago, speculation of a rig count trough offered promise of the oil industry bottoming out. Since then, oil prices seem to have stabilized, but rig counts are a different story. The number of running domestic rigs fell for the sixth straight week on October 2, 2015, reaching 809. Of the 29

U.S. Propane Inventories Reach All-Time High

Seasonal builds began six weeks early in 2015 U.S. inventories of propane and propylene reached 97.7 million barrels as of September 11, the highest level in the 22 years that the Energy Information Administration (EIA) has collected weekly propane inventory statistics, according to a release from the administration. In the first six months of 2015, U.S. propane and propylene inventories

Oil & Gas 360 Chart of the Week

Chart of the Week: U.S. Energy Use in 2014

Petroleum, NatGas, Coal & Nuclear Delivered 89% of U.S. Energy in 2014 U.S. Energy Use: in its September release of the second Quadrennial Technology Review (QTR), AN ASSESSMENT OF ENERGY TECHNOLOGIES AND RESEARCH OPPORTUNITIES, the U.S. Department of Energy delivers 505 pages of research findings and itemizes where the federal government sees opportunities existing for new research to develop energy technologies.

LNG

Natural Gas’s Premium as LNG

Pricing shifts in favor of selling natural gas as LNG As natural gas has become increasingly abundant in the United States, selling production as liquefied natural gas (LNG) has become an ever-more attractive alternative to selling gas production domestically. This chart, developed by EnerCom Analytics, shows the premium price for LNG export compared to the price for natural gas at

Generating 20% IRRs with $38 Oil

EnerCom Analytics’ well cost sensitivity by basin EnerCom Analytics ran an analysis of well costs for various basins in December to help illustrate at what cost wells needed to be drilled to generate at least 20% IRRs. With oil prices down even further from where they were at the end of last year, EnerCom Analytics ran the numbers again, this

Coal vs. Natural Gas: NatGas Takes the Lead

As natural gas prices come more in-line with coal, generators make the switch This chart, provided by EnerCom Analytics, shows the increasing use of natural gas as opposed to coal for electrical generation. April 2015, marked the first time ever that natural gas was responsible for more electrical power generation than coal. The grey and red bars show the percentage

Power Sector Carbon Dioxide Emissions Hit 27-Year Low

Carbon emissions from the power sector at lowest level since 1988 The electric power sector emitted 128 million metric tons of carbon dioxide (MMmt CO2) in April 2015, according to information from the Energy Information Administration (EIA). This level of emissions is the lowest for any month since April 1988. In any year, April is typically the month with the

Marcellus, Utica Driving 85% of Shale Gas Growth Since 2012

Per well efficiencies up 2.6x in the Marcellus and 22.3x in the Utica since 2012 Increased productivity of natural gas wells in the Marcellus and Utica Shale basins is responsible for 85% of increased natural gas production in the United States since 2012, according to the Energy Information Administration (EIA). Natural gas from shale basins is now responsible for 56%