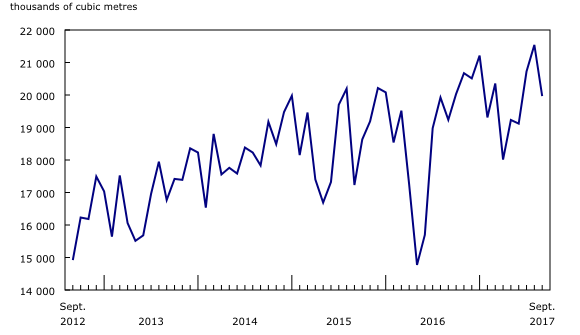
Canada produced 20.0 million cubic meters (125.6 million barrels) of crude oil and equivalent products in September 2017, up 3.8% from the same month a year earlier.
Canada’s statistics arm said the increase was largely attributable to an 11.8% rise in non-upgraded production of crude bitumen, which was offset by declines in synthetic crude (-5.3%) and in light and medium crude (-3.3%) oil. Over the same period, heavy crude oil production rose 1.2% to 2.0 million cubic meters.

Source: CANSIM tables 126-0001 and 126-0003.
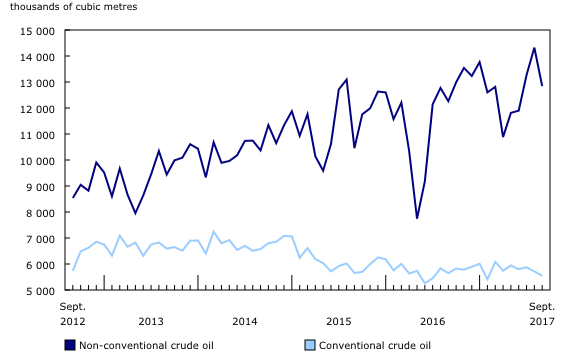
The increase in non-upgraded crude bitumen in September was driven by higher in-situ production (up 11.1% to 7.7 million cubic meters), while mined production decreased 2.9% to 5.8 million cubic meters. Crude bitumen sent for further processing declined 4.4% to 5.5 million cubic meters.
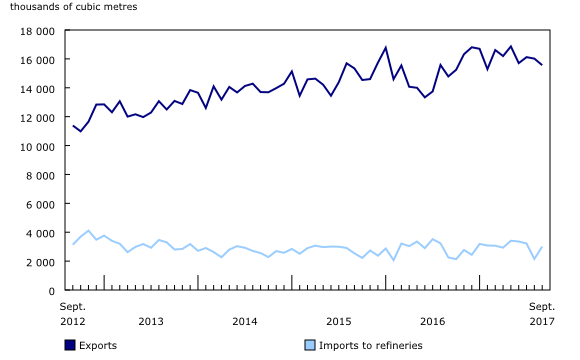
93% of Canadian crude oil went to U.S. via pipeline; 7% went to U.S. via rail, truck and marine vessel
Exports of crude oil and equivalent products were up 5.3% from September 2016 to 15.6 million cubic meters in September. The vast majority of exports (92.6%) were transported via pipelines to the United States, while exports by other means (including rail, truck, and marine) to the United States accounted for the remaining 7.4%. There were no exports to foreign countries other than the United States. Imports to Canadian refineries, which tend to be more volatile, were up 33.1% to 3.0 million cubic meters from September 2016.

Source: CANSIM tables 126-0001 and 126-0003.
Canadian inventories
Closing inventories of crude oil and equivalent products were down 2.3% from the same month a year earlier to 17.8 million cubic meters in September. The total was comprised of refineries (up 2.7% to 3.7 million cubic meters), transporters (down 1.1% to 11.6 million cubic meters) and fields and plants (down 13.6% to 2.5 million cubic meters).
For the quarter ending September 30, 2017, crude oil and equivalents production rose 7.0% from the third quarter of 2016 to 62.2 million cubic meters. This represented the highest quarterly production on record, surpassing the previous high of 61.2 million cubic meters in the fourth quarter of 2016. The increase was largely attributable to high levels of non-upgraded production of crude bitumen. Over the same period, exports rose 8.1% to 47.7 million cubic meters.

Source:
CANSIM tables 126-0001 and 126-0003.
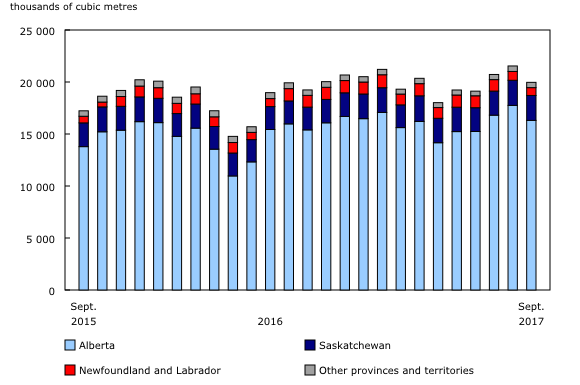
Alberta is king: 87% of Canadian crude oil production in Sept., up 6% from Sept. ‘16
As for provincial production, Alberta produced 16.3 million cubic meters of crude oil and equivalent products in September, up 5.9% from September 2016, and accounted for 81.7% of total Canadian production. Saskatchewan (12.0%) and Newfoundland and Labrador (3.8%) were also key contributors.

Source: CANSIM tables 126-0001 and 126-0003.
In September, Alberta crude oil production (excluding equivalent products) totaled 18.4 million cubic meters. Non-conventional crude oil production, which consists of non-upgraded crude bitumen and synthetic crude oil, increased 4.7% from the same month a year earlier to 12.8 million cubic meters. Meanwhile, conventional production of light, medium and heavy crude oils decreased 1.7% to 5.5 million cubic meters.


