Oil & Gas 360 Publishers Note: To help understand the OPEC + members, take a look at the breakeven crude oil prices. Breakeven is is the fiscal breakeven, the minimum price that a country needs to receive per barrel of crude oil sold for its government to meet its immediate spending needs and balance its budget. This says a lot about what, or how, countries will behave when money is at stake.
On June 6, 2020, members of the Organization of the Petroleum Exporting Countries (OPEC) agreed, along with 10 other partner countries (OPEC+), to extend their pre-existing 9.7 million barrel per day (b/d) production cut through at least July 2020. For many OPEC+ countries, the nearly 50% decline in crude oil prices during the past six months is likely to exert significant pressure on their economies and financial reserves. The extent of this pressure can be assessed by analyzing breakeven oil prices. While breakeven prices for a company generally refer to the minimum oil price required for a well to be profitable, breakeven prices for a country measure the oil price that a government (in the case of a fiscal breakeven) or an economy (in the case of an external breakeven) needs to cover its expenses.
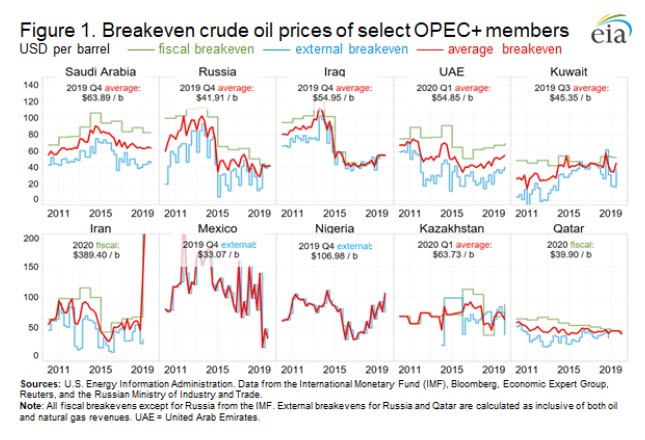
The most commonly used country-level breakeven price is the fiscal breakeven, the minimum price that a country needs to receive per barrel of crude oil sold for its government to meet its immediate spending needs and balance its budget. The fiscal breakeven metric assumes that countries will adjust both their spending and—depending on their ability to influence the global price of crude oil—their production decisions to avoid deficits and smooth public spending. Computed annually by the International Monetary Fund (IMF) for most OPEC+ producers, the fiscal breakeven has varied considerably for most OPEC+ members (and non-OPEC+ members Qatar and Mexico), and since 2010 has ranged from as low as $37.90 per barrel for Kazakhstan in 2018 to as high $389.40 per barrel for Iran in 2020 (Figure 1).

Although the fiscal breakeven is intuitive, it may not accurately reflect the economic constraints facing oil exporters. For example, rather than adjusting spending, loss-making exporters could simply choose to borrow against future revenues or draw down existing financial reserves without adjusting immediate outlays. Similarly, an exporter could also choose—or, for a country with a floating exchange rate, simply allow—its currency to depreciate.
An alternative to the fiscal breakeven is the external breakeven, which is the price a country needs to afford its imports. Just as the fiscal breakeven assumes that a government will adjust public spending in order to balance its budget, the external breakeven assumes that the wider economy will adjust its spending outflows (namely imports) to match its spending inflows (namely oil export revenues). Consequently, if oil prices are higher than a country’s external breakeven, that country can increase public spending or allow its currency to appreciate, while prices lower than the external breakeven suggest that the country must either reduce public spending or allow its currency to depreciate.
The U.S. Energy Information Administration (EIA) calculated the external breakeven prices using quarterly data from the IMF and several central banks, including the Qatar Central Bank and Central Bank of the Russian Federation. A country’s fiscal breakeven is typically higher than its external breakeven, but the two measures tend to move together. As of the end of 2019, Saudi Arabia, Russia, Iraq, the United Arab Emirates (UAE), Mexico, and Qatar had decreased breakeven oil prices relative to the their average levels during the last oil price crash in 2015. Conversely, breakeven oil prices in Iran, and Nigeria increased, while those in Kuwait and Kazakhstan remained about the same.
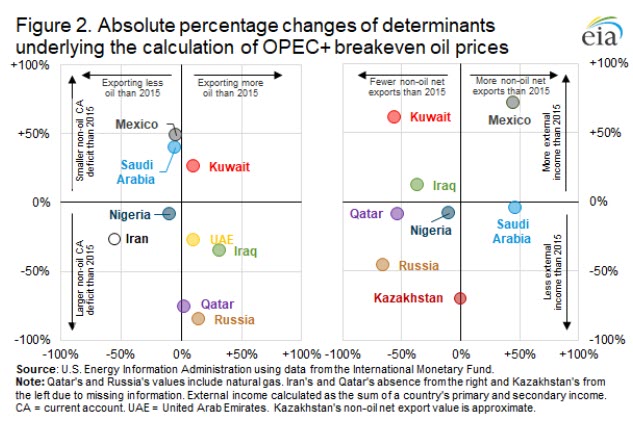
The primary drivers of changes in the external breakeven—and, less directly, the fiscal breakeven—are changes in the amount of crude oil a country exports, and changes in a country’s non-oil current account, which is the net of a country’s financial inflows (such as exports) and outflows (such as imports) (Figure 2). As shown in the left side of Figure 2, most of the studied countries exported about the same amount (within 15%) of crude oil—or, in the cases of Russia and Qatar, crude oil and natural gas—in 2019 as they did in 2015. The notable exceptions were Iran (decreasing 55%, largely as a result of sanctions) and Iraq (increasing 32%, largely as a result of progress restoring pre-Iraq War fields).

Even more variation occurs in the evolution of the countries’ non-crude oil current accounts. Logically, a country that exports more (or imports fewer) non-oil goods and services should be less vulnerable to crude oil price declines. Mexico, Saudi Arabia, and Kuwait ran non-oil current account deficits that were smaller in 2019 than 2015, but deficits in other countries EIA studied were larger (Figure 2, left side). Although the larger non-oil current account deficits of Qatar, Russia, Iraq, and the UAE were somewhat offset by their larger oil export volumes, the growing non-oil current account deficits of Nigeria and Iran were only further exacerbated by declines in their oil export volumes.
The non-oil current account can itself be further separated into two components: non-oil net exports (for instance, exports of foodstuffs) and other external revenues. Of the countries EIA studied, on net only Mexico and Saudi Arabia exported more non-oil goods and services in 2019 than they did in 2015, and the others exported between 18% less (Nigeria) and 66% less (Russia) (Figure 2, right side). Although increases in external income (such as remittances, tariff revenues, and government-to-government transfers) allowed some countries to partially offset these declines in non-oil export revenues, this trend was itself offset by the tendency of external income to be a much smaller flow than non-oil export revenue. For example, although the decline in Kuwait’s non-oil export revenue was nearly proportionate to the increase in external revenue in percentage terms (-55% vs. +61%), since 2015, the former has been about twice the size of the latter in absolute terms.
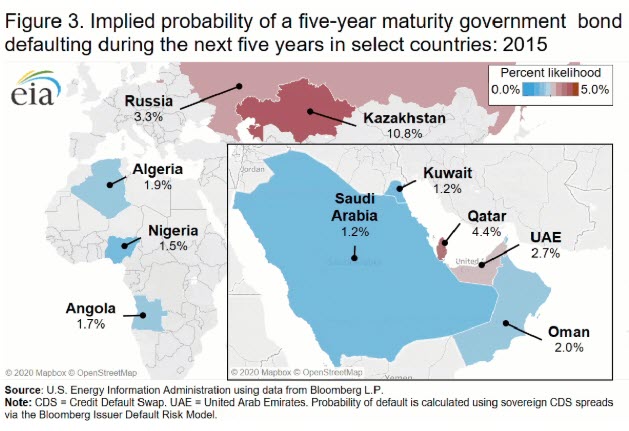
A country with a healthier economy or larger oil revenues should be less likely to default on its financial obligations than a country with falling oil revenues or a shrinking tax base. Although changes in a country’s breakeven oil price indicate economic pressure, they may not necessarily reflect changes in investors’ expectations. One way to measure these expectations is through debt markets, or, more specifically, the probability that a country’s government-issued bonds will default. This probability can be inferred from differences in the pricing of financial contracts known as sovereign credit default swaps (CDS) (Figure 3). But while most of the countries EIA studied (Saudi Arabia, Russia, Iraq, the UAE, Mexico, and Qatar) reduced their breakeven oil prices between 2015 and 2019, only Russia, the UAE, and Mexico saw declines in their CDS implied default probabilities, with the rest either increasing or remaining unchanged.

Over the last six months, CDS implied default probabilities in most countries have further increased. As of June 3, the 2020 year-to-date average probability of default increased relative to the 2019 average in seven key oil producing countries, including Mexico (4.2% to 5.7%), Russia (2.6% to 3.0%), and Qatar (10.4% to 11.7%). While these probabilities are significantly lower than some of the world’s more insolvent countries (Venezuelan five-year bonds, for example, have a CDS implied default probability of 98.9% as of June 3), they suggest increasing economic pressures for major oil exporters as a result of the prevailing low oil price environment.
U.S. average regular gasoline and diesel prices rise
The U.S. average regular gasoline retail price rose more than 6 cents per gallon from the previous week to $2.10 per gallon on June 15, 57 cents lower than the same time last year. The Gulf Coast price increased nearly 10 cents to $1.78 per gallon, the East Coast price rose more than 7 cents to $2.02 per gallon, the Rocky Mountain price increased nearly 6 cents to $2.23 per gallon, the West Coast price rose nearly 5 cents to $2.68 per gallon, and the Midwest price rose nearly 4 cents to $2.03 per gallon.
The U.S. average diesel fuel price rose nearly 1 cent from the previous week, remaining at $2.40 per gallon on June 15, 67 cents lower than a year ago. The Midwest price increased nearly 2 cents to $2.26 per gallon, the West Coast price rose more than 1 cent to $2.93 per gallon, the Gulf Coast price rose less than 1 cent to remain at $2.17 per gallon, and the East Coast price was unchanged from the previous week at $2.50 per gallon. The Rocky Mountain price fell nearly 1 cent, remaining at $2.35 per gallon.
Propane/propylene inventories rise
U.S. propane/propylene stocks increased by 2.7 million barrels last week to 69.0 million barrels as of June 12, 2020, 4.1 million barrels (6.3%) greater than the five-year (2015-19) average inventory levels for this same time of year. East Coast, Gulf Coast, Midwest, and Rocky Mountain/West Coast inventories increased by 1.3 million barrels, 0.7 million barrels, 0.4 million barrels, and 0.3 million barrels, respectively.


