Blackbird Energy (ticker: BBI) has released its financial and operational results for the quarter ended October 31, 2017, Q1 2018 in Blackbird’s financial calendar.
Highlights
Q1 2018 Production: While on production during the quarter, Blackbird produced 5.6 MMcf/d of natural gas, 863 bbls/d of condensate and 80 bbls/d of NGLs for total production of 1,876 BOEPD. During the three months ended October 31, 2017, Blackbird averaged production of 2.1 MMcf/d of natural gas, 328 bbls/d of condensate and 30 bbls/d of NGLs for total production of 712 BOEPD despite significant third party natural gas processing plant shut-downs, which resulted in significant increases to per BOE operating costs. Blackbird was only able to produce for approximately 35 days during the first quarter of 2018 compared to 92 total calendar days in the quarter which resulted in $2.6 million of revenue.
Capital Investment: Blackbird invested $29.2 million during the three months ended October 31, 2017, drilling 2 gross (1.2 net) wells, completing 4 gross (2.4 net) wells, recompleting 1 gross (1.0 net) well and bringing 2 gross (2.0 net) wells on production. At October 31, 2017, the company also had the 6-33-71-7W6 drilling and 2-20-70-6W6 recompletion operations in progress which were subsequently completed in November.
- Q1 2018 Revenue: $2.6 million during the three months ended October 31, 2017
- Q1 2018 Operating Netback: $14.37/BOE during the three months ended October 31, 2017
- Total Assets: $194.6 million at October 31, 2017 compared to $90.9 million at October 31, 2016, representing a 114% increase
- Balance Sheet: Working capital of $21.3 million at October 31, 2017, which included $33.8 million of cash and no bank debt
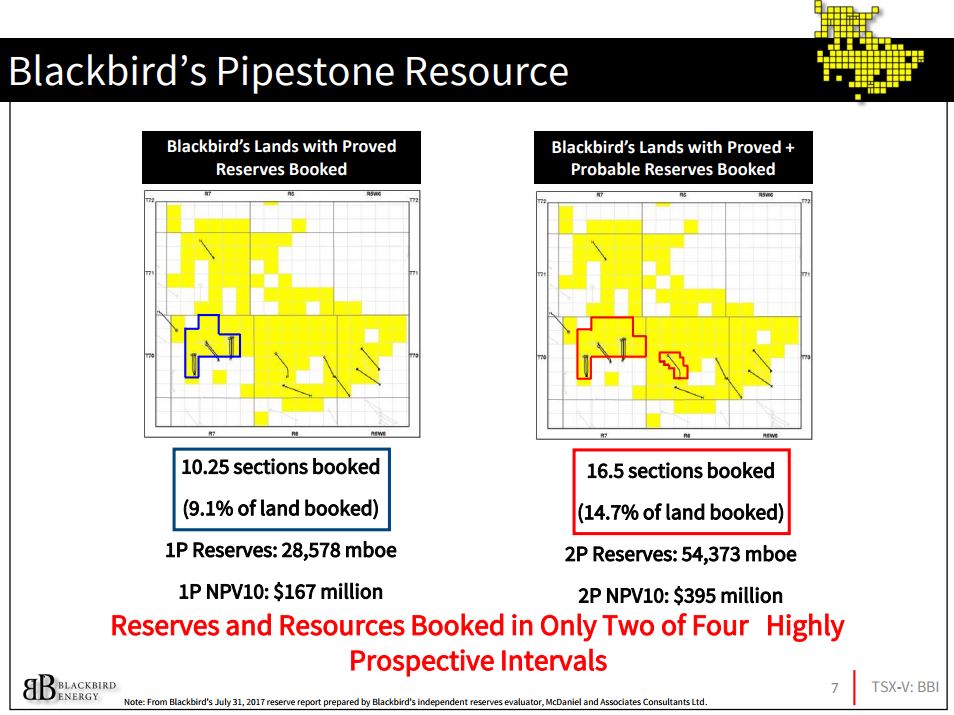
- Land: During the three months ended October 31, 2017, Blackbird acquired 8 gross (8 net) sections of additional Montney lands for cash consideration of $1.4 million, increasing its total Pipestone/Elmworth Montney land position to 131 gross (114.9 net) sections as of October 31, 2017
Operations update and outlook
“Subsequent to October 31, 2017, Blackbird has continued to execute on its planned drilling and completion program. The company will continue its momentum into calendar 2018 with production/test results expected from a number of wells before the end of March,” the company said. “Blackbird expects that these results will showcase the productivity of the company’s resource on the western development block of its Pipestone/Elmworth land base, as well as delineate the acreage to the north and east.”
The company said that the 02/6-26-70-7W6 Upper Montney Development Well was completed using a combination of the Stage Completions Inc. Generation Four Sleeve System and plug and perf technology. The well is currently producing with preliminary production results expected in early 2018.
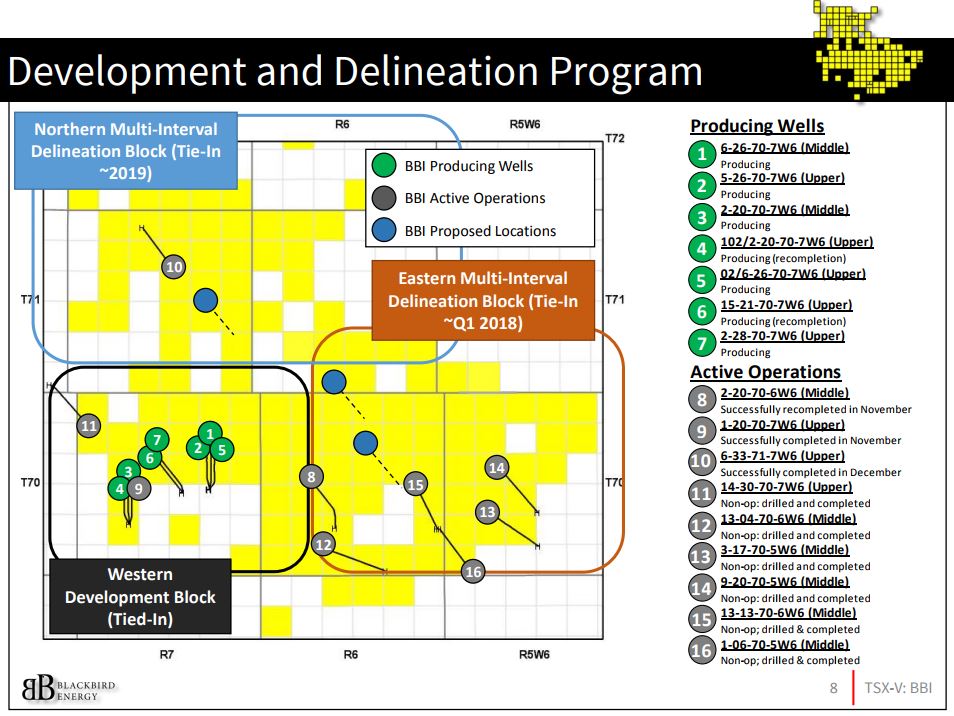
As for the 2-20-70-6W6 Middle Montney Development Well, it was recompleted in November, utilizing plug and perf technology. This well is expected to confirm the presence of and extend the “Volatile Oil” window more than 5 km eastward from Blackbird’s previous wells. Test results from this well are expected in February or March of 2018.
The 6-33-71-7W6 Upper Montney Delineation Well was completed in December using the Stage Generation Four Sleeve System exclusively. “This is a significant well for Blackbird and will delineate the northern extent of Blackbird’s land while also retaining 14 sections of Montney rights,” the company noted. Test results from this well are expected in February or March of 2018.
Summary table
| By the Numbers – Q1 2018 | ||||||
| (CDN$ thousands, except where otherwise noted) | Three months ended October 31 | |||||
| 2017 | 2016 | % Change | ||||
| Financial | ||||||
| Petroleum and natural gas revenue | 2,582 | 15 | 17,113 | |||
| Funds used in operating activities | (2,114 | ) | (1,235 | ) | 71 | |
| Net loss and comprehensive loss | (1,737 | ) | (1,059 | ) | 64 | |
| Net loss per share – basic and diluted ($/share) | (0.00 | ) | (0.00 | ) | – | |
| Total assets | 194,587 | 90,858 | 114 | |||
| Working capital | 21,317 | 30,064 | (29 | ) | ||
| Capital expenditures | 29,241 | 7,350 | 298 | |||
| Operating | ||||||
| Production | ||||||
| Condensate (bbls/d) | 328 | – | – | |||
| NGLs (bbls/d) | 30 | – | – | |||
| Natural gas (Mcf/d) | 2,112 | – | – | |||
| Non-core (BOEPD) | 2 | 14 | (86 | ) | ||
| Total (BOEPD) | 712 | 14 | 4,986 | |||
| Liquids ratio (%) | 50 | – | – | |||
| Condensate gas ratio (bbls/MMcf) | 155 | – | – | |||
| Total liquids gas ratio (bbls/MMcf) | 170 | – | – | |||
| Average Montney realized selling prices | ||||||
| Condensate ($/bbl) | 60.50 | – | – | |||
| NGLs ($/bbl) | 30.26 | – | – | |||
| Natural gas ($/Mcf) | 3.44 | – | – | |||
| Netbacks ($/BOE) | ||||||
| Petroleum and natural gas revenue | 39.41 | 11.65 | 238 | |||
| Royalties | (2.09 | ) | – | – | ||
| Operating expenses | (10.62 | ) | (82.30 | ) | (87 | ) |
| Transportation and processing expenses | (12.33 | ) | – | – | ||
| Operating netback(1) | 14.37 | (70.65 | ) | 120 | ||
| Pipestone / Elmworth Montney sections of land (net) | 114.9 | 87.25 | 32 | |||
Notes:
(1) See the company’s Q1 2018 financial statements and related management’s discussion and analysis filed on SEDAR for further discussion and cautionary statements regarding the figures above
(2) See “Non-IFRS Measures”
Additional commentary from Blackbird CEO Garth Braun, released Dec. 16, 2017, can be found here.


