By: Tim Rezvan, CFA- EnerCom
As we approach the midpoint of 3Q earnings season in the oil patch, we continue to see strong signs of capital discipline from the industry, with excess CF generally being earmarked for debt reduction, dividend growth and/or share repurchases.
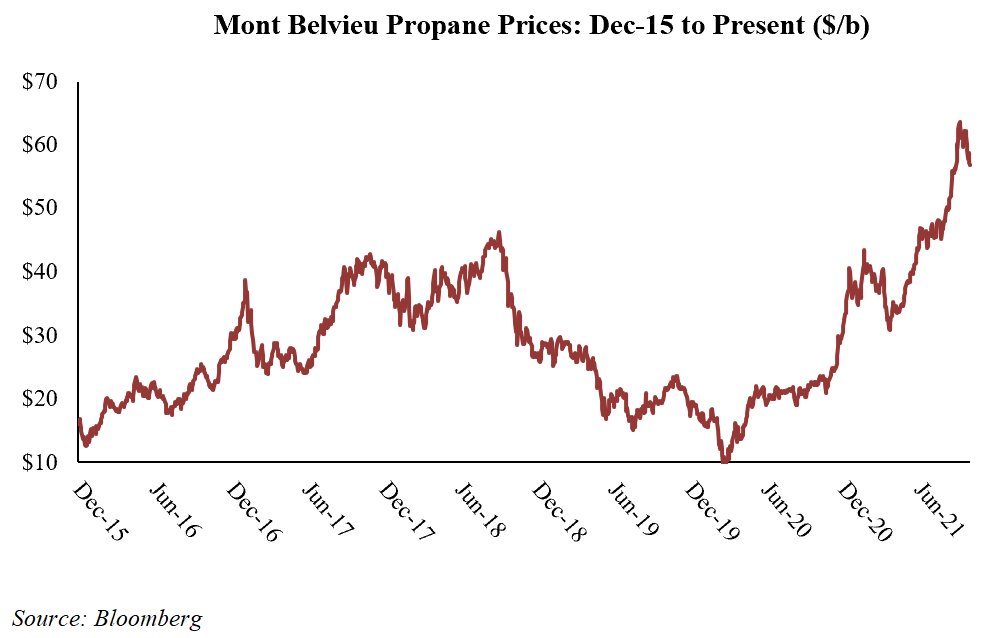
But while capital discipline strengthens balance sheets, it does not increase beleaguered inventory levels across the hydrocarbon spectrum. We want to highlight the tenuous dynamics facing propane inventories, and quantify the current/future upside to price realizations for wet gas producers with significant NGL exposure. With propane prices averaging $61/b MTD and significant drivers of upward pricing pressure in place, we believe this is an important theme for investors and industry.
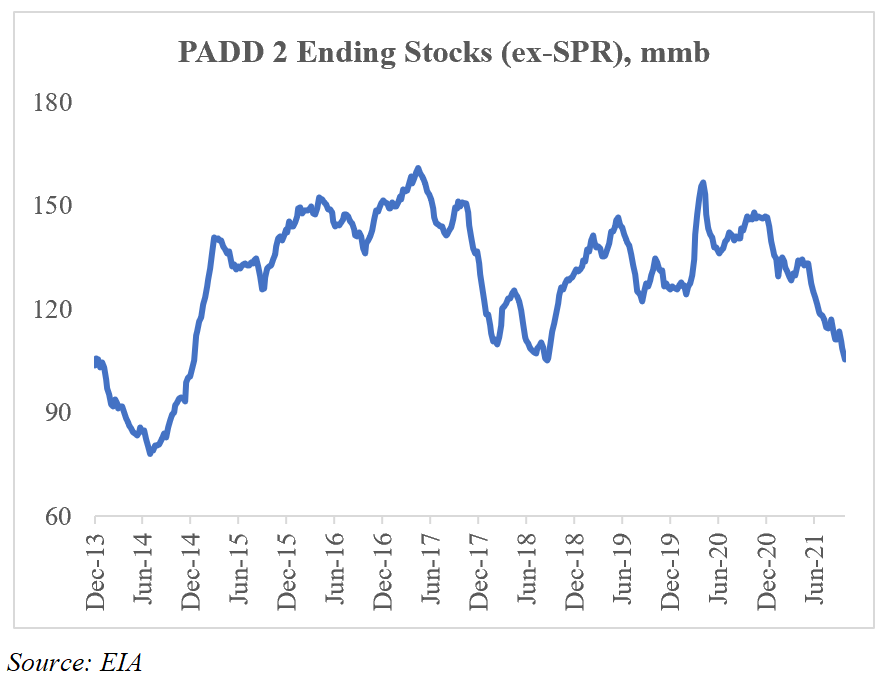
In recent days, much attention has been focused on oil inventories (especially PADD 2, the region covering Oklahoma up to the Dakotas, east to Ohio), amid increasing demand for refined products. As seen below, PADD 2 inventories decreased 51 mmb from April 2020 (and 28 mmb from June 2021) to 105 mmb, a level not seen since September 2018. But we are not here today to talk about oil.
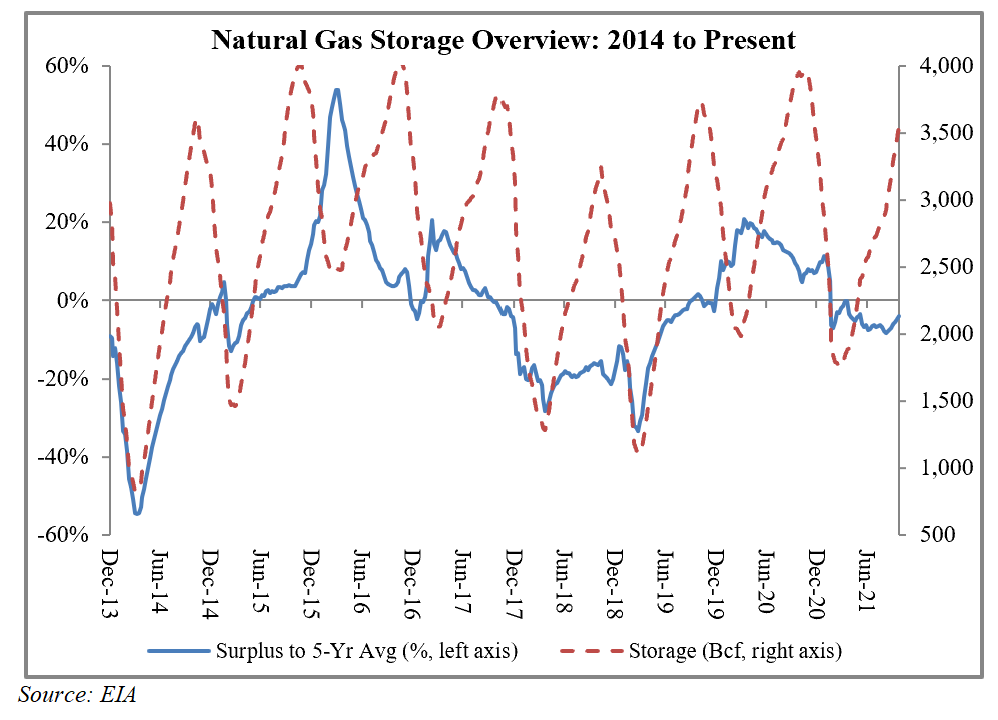
And much attention has been focused on U.S. natural gas inventories as we prepare for the winter drawdown. As seen below, inventories are nearly in-line with the prior five-year average. While we acknowledge the bullish tailwind to prices from increasing demand (LNG exports, pipelines to Mexico), we continue to view weather as the ultimate near-term swing factor, as evidenced by recent volatility for the front-month Henry Hub natural gas price. But we are not here today to talk about natural gas.
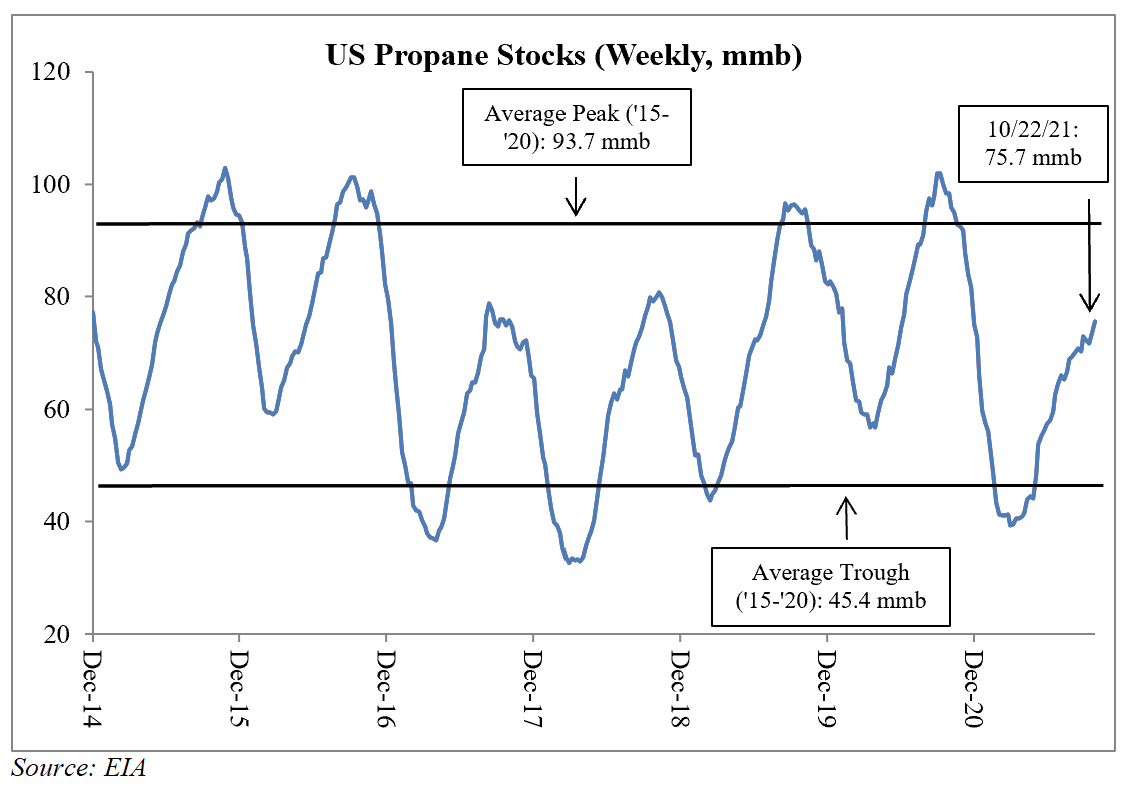
Instead, we are here today to talk about propane, an oft-overlooked component of the NGL production stream that is an increasingly important fuel source in Asia and Europe. As we approach the end of the seasonal inventory build in propane stocks, the U.S. is at a significant deficit. As seen in the chart below, propane inventories are poised to peak at 76 mmb, 24% below the average peak from 2015-2020. This can be partially explained by a lower than average trough inventory number in early 2021 (39.2 mmb).
But a critical part of the story is rising propane exports. As seen in the second chart below, propane exports steadily increased in the back half of last decade and continue to ramp. They averaged 1.18 mmb per week YTD, +116% from 2015, and +3% from 2020.

The energy supply crunch currently crippling Europe and Asia highlights the value of exportable fuel sources from the U.S. The majority of propane exports goes to Asia, for both petrochemical and heating demand. According to the EIA, 58% of all U.S. propane exports have gone to Asia since April 2020.
While propane prices are largely correlated to oil, export growth is proving to be an additional component of pricing strength. From 2015-2020, propane prices at the Mont Belvieu, TX pricing hub averaged 49.7% of NYMEX WTI. This ratio has increased to 64.7% YTD and 74.8% MTD. Operators with significant exposure to wet gas in their shale portfolios stand to doubly benefit from the phenomenon of rising WTI prices and stronger realizations relative to WTI heading into 2022, especially as supply growth across all hydrocarbon streams remains muted into winter.
Tim Rezvan, CFA is a Director at the energy consulting firm EnerCom, Inc. He has experience in sell-side equity research, asset management, corporate strategy, investor relations and ESG. Mr. Rezvan’s sell-side equity research experience in the E&P industry focused on leverage trends, full-cycle costs, emerging unconventional resource plays, M&A analysis and corporate governance.
EnerCom, Inc. is the energy industry’s leading communication experts. We can help you with corporate strategy, ESG, media and government and stakeholder relations to effectively communicate your company’s story. Contact: services@enercominc.com
[contextly_sidebar id=”c100WrZMn8Bgzz2uhHRPWTOFHeGztgvf”]

