By Andrew Nichols: EnerCom
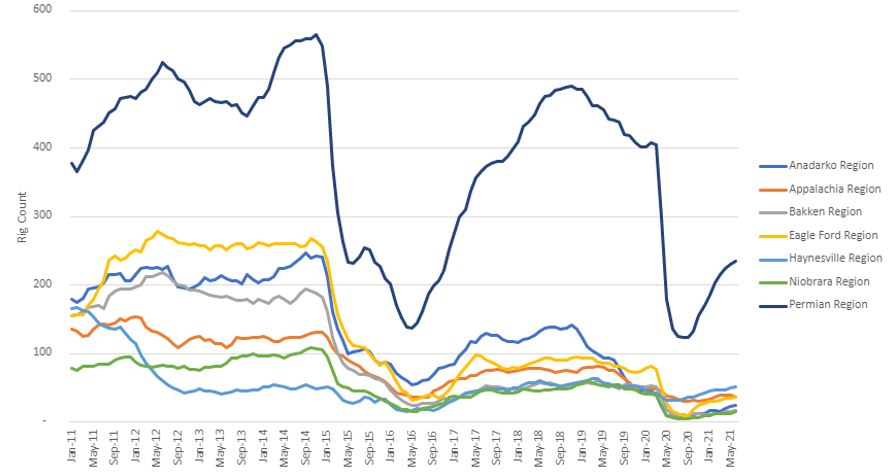
In the past 10 years, we have seen many shifts in the number of active oil rigs in the top 7 regions in the United States. Before 2016, when the price of oil dropped to $29 a barrel, most regions stayed about the same except for an increase in the Eagle Ford region and a large decrease in the Haynesville region. After the price bounced back the Permian region grew massively adding over 200 new rigs due to strong well economics in the area. At the start of 2020, we saw a massive drop in rig count due to both COVID-19 and the Saudi Arabia and Russia “price war.” This began in March of 2020 when Saudi Arabia facilitated a 65% fall in the price of oil in a single quarter. This started due to a break-up in the dialog between OPEC and Russia over a proposed cut in the production of oil. Russia refused to cooperate with the agreement and caused a fallout within the OPEC alliance. Although an agreement didn’t happen until July 2021, the United States started increasing the number of oil rigs in September of 2020. Since then, the Permian region has remained the top producer of oil while the other 6 regions stayed close together in number.


