Since 1990, China and India have accounted for 57% of the total increase in world energy consumption
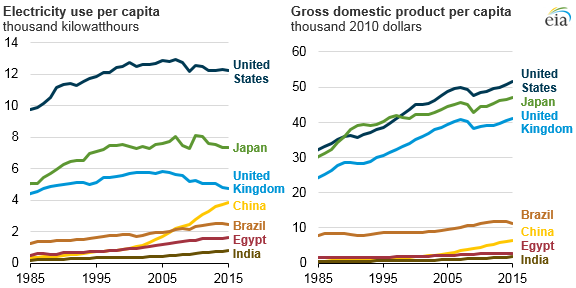
Earlier this week the EIA put out data that revealed that the world’s developing countries used higher amounts of electricity than OECD countries. In a graph, the heavy users were China, India, Brazil and Egypt, with the U.S., UK and Japan being close to zero growth or below zero growth for electricity usage.

This relationship between energy usage and economic growth has changed in recent times for several reasons, according to the new data by the EIA. The EIA said that reasons include the countries’ relative levels of development, electrification, economic makeup, and income levels.
Yesterday the EIA published its economic growth cases for China and India, giving some indication of where their economies may be headed, which affects energy demand.
China and India determine worldwide energy consumption trends because of their large size, continuing development runway and anticipated future economic growth. The EIA has compared three economic growth scenarios. The low economic growth case projects slower economic growth, whereas the high economic growth case projects faster economic growth. The EIA then compared the low and high rates of growth with a down-the-middle baseline IEO2017 Reference case.
“The reference case assumes continual improvement in known technologies based on current trends,” explained the EIA. “The reference case relies on the views of leading economic forecasters and demographers related to economic and demographic trends for 16 world regions based on OECD membership status.”
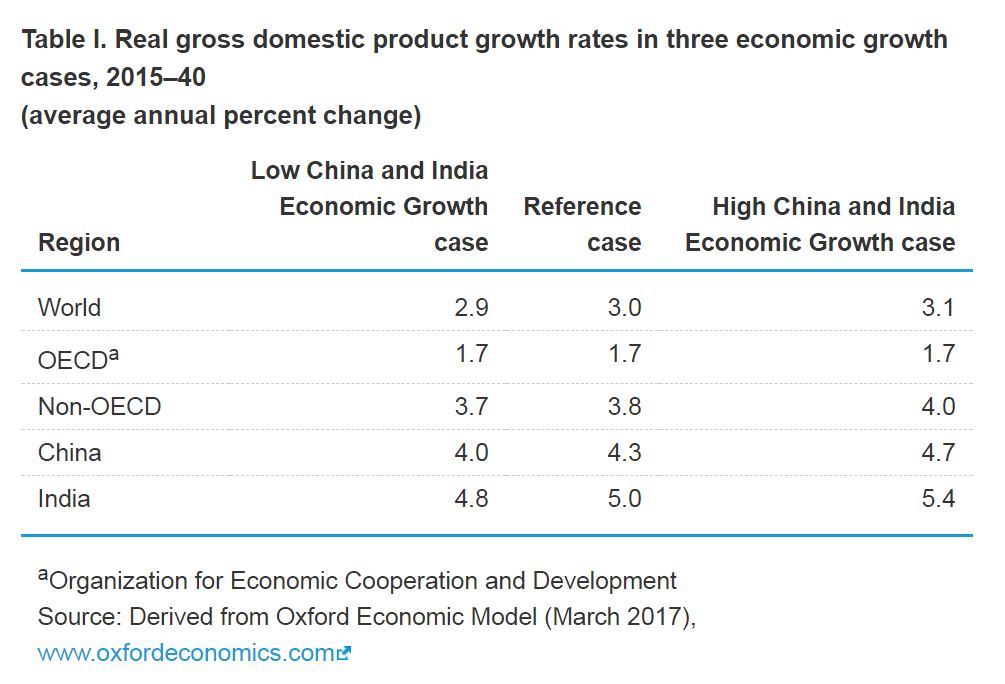
The low growth rate scenario projects India’s average GDP 0.2 percentage points lower than the IEO2017 Reference case and 0.3 percentage points lower for China. In the high economic growth case, China and India’s average GDP growth rates are 0.4 percentage points higher than the Reference case.
“The range of growth rates may appear to be small, but they do have measurable impacts, particularly when looking at the cumulative effects,” explained the EIA. “For example, total energy consumption in the high economic growth case is 6% higher in China and 8% higher in India than in the Reference case in 2040.”
World energy consumption
Higher economic growth in China and India benefits their trading partners, leading to total world energy consumption of 755 quadrillion BTU in 2040, which is 3% higher than the 736 quadrillion BTU projected in the IEO2017 Reference case.
Industrial sector energy consumption in China and India increases the most in the high economic growth case. Since 1990, China and India have accounted for 57% of the total increase in world energy consumption.
China uses 66% more energy than projected
According to the EIA, China has been the most important country for growth in world energy demand over the past several decades, but predicting China’s future economic growth has been anything but an exact science and has resulted in several revised long-term projections.
“In the 1990 edition of the IEO, EIA anticipated China’s economy would grow by 4.5%/year from 1990 to 2000 and by 4.2% from 2000 to 2010,” said the EIA. “However, China’s GDP actually grew by an estimated 10.4%/year from 1990 to 2000 and by 10.5%/year from 2000 to 2010.”
The EIA projected in IEO1990 that Chinese energy consumption would be about 38 quadrillion BTU in 2010. China actually consumed 100 quadrillion BTU in 2010, approximately two-thirds more than what the IEO1990 predicted.
India’s GDP and energy consumption up until 2010
In 1999 the EIA projected that India’s GDP would grow by an average 5.2% per year from 2000 to 2010. However, India’s GDP actually grew by an estimated 7.4% per year from 2000 to 2010. Additionally, the IEO1999 projected Indian energy consumption of 21 quadrillion BTU in 2010, 5% lower than the 22 quadrillion BTU of energy actually consumed.
Although India’s economic growth has been slower than China’s, India’s economic growth is still expected to determine the growth of worldwide energy demand in the future.
The EIA said, “India has a large workforce and a history of strong economic growth. A combination of lower interest rates and moderate inflation in India supports expected increases in both consumption and investment in the near term.”
Three economic growth cases for China
Reference case
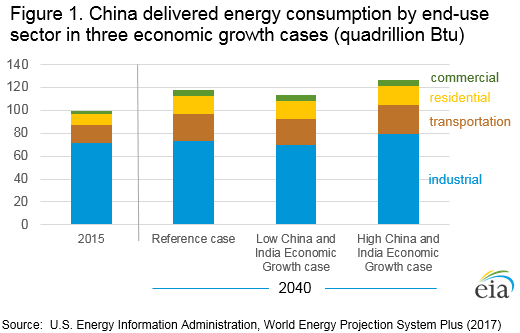
In the IEO2017 Reference case, energy consumption in China rises by 1.0% per year, from 133 quadrillion BTU in 2015 to 173 quadrillion BTU in 2040, a nearly 30% increase over the projection period. Virtually all of the increase in China’s delivered energy consumption is in residential and commercial buildings and transportation sectors. Each of the sectors account for nearly half of the increase in end-use sector energy use.
The pace of growth in residential sector energy consumption is faster than all other sectors as China’s demand for energy services increases. This demand results from higher per capita income and quality-of-life improvements, accompanied by an increase in urban population and growing access to nontraditional, marketed energy in rural areas. GDP per capita in China grows by 4.2% per year from 2015 to 2040, and residential sector energy consumption rises by 2.2% per year.
The country’s strong economic growth leads to rising standards of living and translates to increasing demand for personal travel. Total transportation energy use in China increases by an average 1.7% per year in the Reference case over the projection period. Much of the increase in demand is for passenger transport.
Passenger modes of transportation account for nearly 80% of the increase in China’s transportation energy use, with light-duty vehicles accounting for 34% of the increase in total transport energy consumption, and air travel accounting for 26%.
Energy consumption in China’s industrial sector remains fairly flat through 2040 in the Reference case. This projection is different than past projections, where much of China’s economic growth was the result of robust growth in the country’s energy-intensive industries. Recent announcements and policies suggest that the Chinese government is guiding the country out of energy-intensive manufacturing and into a more service-oriented economy.
This shift is evident in the Reference case projections, where commercial sector energy consumption increases by 1.9% per year from 2015 to 2040, and the industrial sector shows almost no growth.
High economic growth case
GDP per capita in China at the end of the projection period is about 10% higher than in the Reference case. Total energy consumption in the high growth case rises from 133 quadrillion BTU in 2015 to 184 quadrillion BTU in 2040, compared with 173 quadrillion BTU projected for China in the Reference case.
China’s industrial energy use in the high growth case increases by an average 0.4% per year from 2015 to 2040, compared with a 0.1% per year increase in the Reference case.
Low economic growth case
GDP per capita in China is 6% lower than in the Reference case in 2040. China’s total energy consumption in the low growth case only increases to 166 quadrillion BTU in 2040, about 4% lower than the Reference case projection of 173 quadrillion BTU in 2040. The industrial sector shows an absolute decline in energy use from 72 quadrillion BTU in 2015 to 70 quadrillion BTU in 2040.
Three economic growth cases for India
Reference case
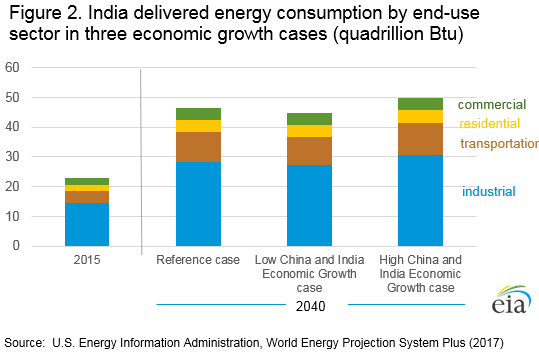
In the Reference case, energy consumption in India rises by 3.1% per year, from 28 quadrillion BTU in 2015 to 61 quadrillion BTU in 2040. While India’s energy consumption more than doubles over that period, the country is still projected to consume less than half the energy that China consumes today, even though India’s population is projected to surpass that of China by 2025 and to be almost 20% higher than China’s population in 2040.
In addition, India’s per capita GDP almost triples over the 25-year projection, but it remains nearly 40% lower than the world average through 2040. Low per capita income in India limits potential growth in consumer demand for energy.
Over the 2015-2040 projection period, 60% of the projected increase in India’s total delivered energy consumption occurs in the industrial sector in the Reference case. The industrial sector accounts for the largest increment in the country’s delivered energy use, but the transportation sector grows at a faster rate.
The transportation sector, which accounts for 28% of the increase in energy demand according to the Reference case projection, grows 4.0% per year from 2015 to 2040, compared with a 2.7% per year projected increase in industrial sector energy consumption.
Two-thirds of the increase in transportation energy demand is for passenger travel, with light-duty vehicles accounting for more than half of the total increase. The commercial sector’s delivered energy consumption also grows at a faster rate compared to the industrial sector, increasing by 2.9% per year through 2040.
High economic growth case
Real GDP in India grows by an average annual rate of 5.4% from 2015 to 2040, compared with the Reference case annual growth rate of 5.0%. Total energy consumption in 2040 for India rises to 65 quadrillion BTU, compared with 61 quadrillion BTU in the Reference case.
The projected increase in industrial energy use from 2015 to 2040 is 16% higher than the increase projected in the Reference case, 14% higher for the buildings sector, and 12% higher for the transportation sector.
Low economic growth case
Real GDP in India grows by 4.8% per year from 2015 to 2040, 0.2 percentage points lower than in the Reference case. India’s total energy consumption in the low growth case increases to 58 quadrillion BTU in 2040, about 4% lower than the Reference case projection of 61 quadrillion BTU for that year.
Energy use in the industrial sector is 1.1 quadrillion BTU lower in the low growth case than in the Reference case, the largest projected absolute difference among all of all the end-use sectors.
Other countries
High economic growth rates for China and India project worldwide average GDP growth increases by 3.1% per year, compared with 3.0% per year in the Reference case. In the high growth case, world energy consumption is 3% (19 quadrillion BTU) higher than in the IEO2017 Reference case in 2040.
Low economic growth rates for China and India project worldwide GDP increases by 2.9% per year between 2015 and 2040. In 2040, total world energy consumption is projected to be 1% (about 10 quadrillion BTU) lower than in the IEO2017 Reference case.


