(Oil and Gas 360) – While Temperatures Delightfully Mild Keep The Consensus Natural Gas And Oil Bearish, Deep Data Continues Showing Bullish, Supply/Demand Trends.
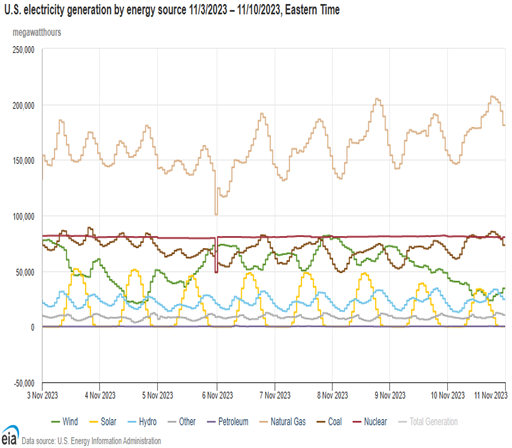
Our prediction, that many will soon be caught oil and natural gas short is based on our decades of analysis of The Climate and constant focus on the economy and markets. Last week last year natural gas produced 38.7% of all the electricity needed. Intra-Day electricity generation data shows that last week last year natural gas was the largest supplier of the nation’s electricity and did the most to provide when and where needed (Figure 5, orange line). While wind (green line) and sunshine (yellow line) provided much, they are poor “when needed” and “where needed” supply sources.

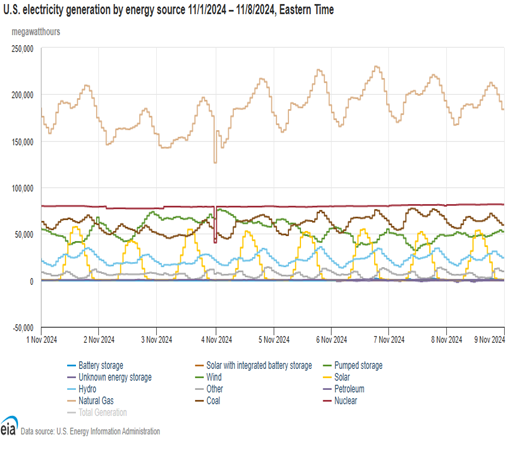
Although last week was 1.3 °F warmer than last week last year 1.7% more electricity needed was provided by natural gas producing 13.9% more YOY. Electricity generation to serve the U.S. last week (Figure 6) averaged 424,867 megawatthours per day. That was 1.7% more than 417,836 megawatthours (Mwh) per day last year (Figure 5). Natural gas generation last week averaged 184,305 Mwh (orange line), 43.4% of the total and 22,495 (13.9%) more than 161,811 last year. Natural gas provided notably more because coal produced 8,454 less, nuclear produced 1,920 less and wind produced 4,978 less. Although solar generation increased 12.2% year-over-year (YOY), 16,761 produced, 3.9% of the total was only a 1,818 YOY increase. Natural gas inventory increased much last week because demand for heating was minimal.

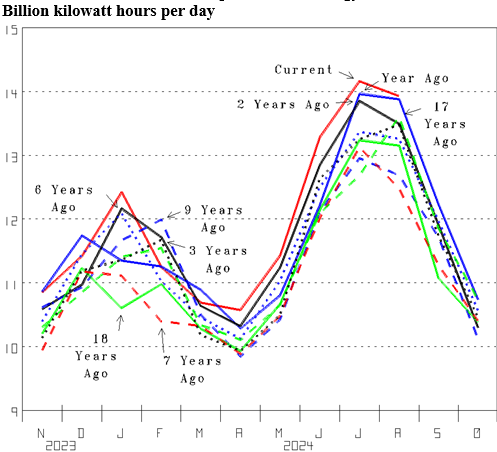
While another Delightfully Warm Winter is the forecast, forecasts are always too warm. And the last two Winters delightfully mild can have natural gas demand greatly exceed expectations. The economy growing and new uses have U.S. monthly electricity generation showing YOY increase (Figure 7). However, while January last Winter set a record high (red line), December and February were low. And while December two Winters ago set a record high (blue line), January and February were low. Electricity demand increasing will have natural gas demand increasing. If the wind patterns that certainly exist and the cold air that certainly exists (Figure 1) result in the cold Winter overdue, infrastructure trends can take gas inventory (Figure 2) from up in record high territory down to setting new record lows.

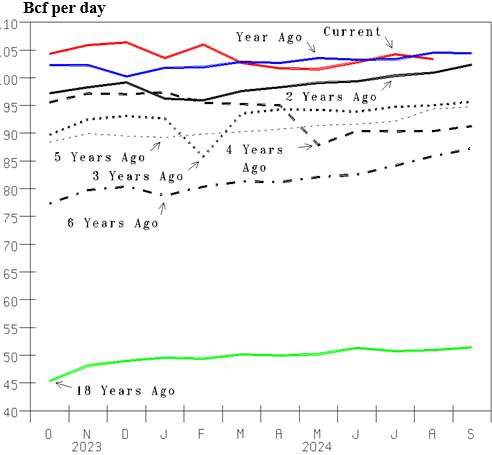
And natural gas supply falling well short. The Fracking Revolution has more than doubled U.S Dry-Marketed natural gas production (Figure 8). However, the effort to produce more down much has Dry-Marketed production stagnating (red line). Yes, the many obstacles the current U.S. Administration has enacted will soon change. However, lead times are long, and capacity (people and equipment) is down much from what doubled production. Infrastructure trends needing much more, fossil-fuel production growth pursuit down, Over There growing too, conventional energy still low, current rulers working to have it slow, + much poorly understood has conventional-energy-Bullish set up.

By Michael D. Smolinski with Energy Directions for oilandgas360.com


