(Oil & Gas 360) – Much needing to be done will need much more, consensus-beating oil & natural gas. Especially because the climate has expectations that are extra low.
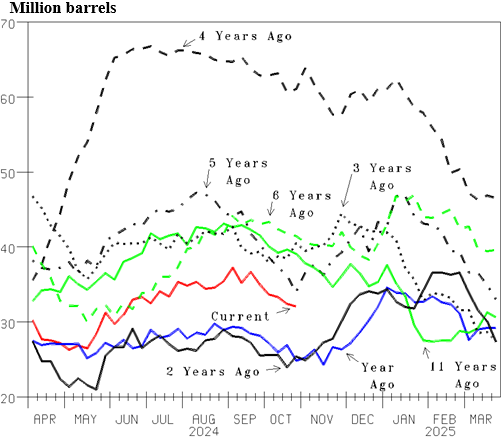
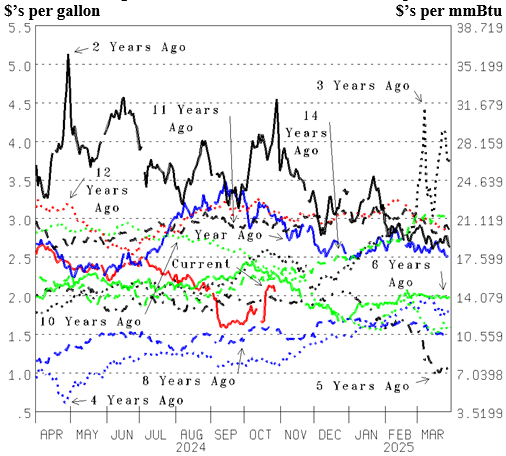
The climate, delightfully mild is also helping deflate oil demand, prices and expectations. While infrastructure trends are reducing the quantity of oil keeping us warm and healthy through Winter, the last two Winters delightfully mild has distillate oil (diesel and heating) inventory high on the U.S. East Coast (Figure 7, red line). The area of the country where heating oil is still a major source. This inventory rising toward 37.2 million barrels (mmb) as September began dropped the East Coast spot market price of distillate oil (Figure 8). Although this inventory is down to 32.1 mmb last week, that is 7.3 more than last year (blue line). Distillate inventory in the rest of the country, 5.7 mmb less than last year, has many set up to soon be caught oil short. Helped by the rest of the Northern Hemisphere also overdue for a cold Winter.

East Coast distillate-oil inventory (and only East Coast) rising into September provided a big, buy-low opportunity. What is happening with all oil and natural gas right now. East Coast distillate oil inventory experiencing a significant year-over-year (YOY) increase into September (Figure 8) deflated the East Coast distillate oil price to $2.00 per gallon in August and then dropped it to $1.589 per gallon in September (Figure 8, red line). While that is a big drop, it is $11.186 per mmBtu.
Distillate oil a backup to natural gas and $13.45 per mmBtu the latest price for natural gas in the Netherlands is why we predict the U.S. price of natural gas rises to $7 per mmBtu and remains there quite a few years, to restore production growth that keeps up with significant, consensus-beating worldwide demand growth.

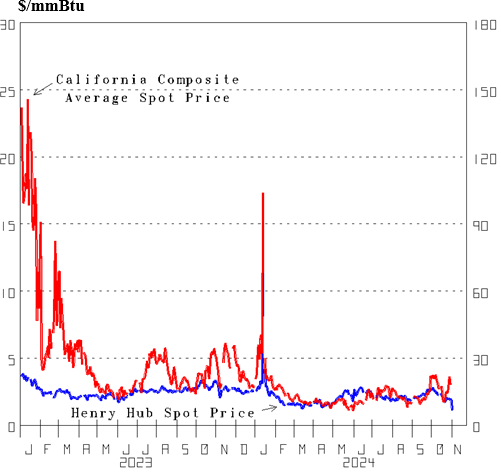
The nature of natural gas prices not understood is another factor that has almost all set up to soon to be caught natural gas short. The Henry Hub price of natural gas most dominant and it down below $2.00 per mmBtu (Figure 9, blue line) has those aware and thinking about it with low expectations. Nevertheless, back last January when much was suddenly needed (Figures 5 and 6), the price jumped up to a $13.080 per mmBtu high. High prices not uncommon is more evident in the daily, California Composite, average spot price (red line). High demand and inventory low in January of 2023 jumped this price up toward $25 per mmBtu and average $11.994 during January and February. It jumped to $17.34 with last January’s cold air (Figure 5). High prices reflect suppliers committed but short of the sudden big demand jump, needing to get someone with supply to give it up. Including, how difficult they believe it will be to replace it.

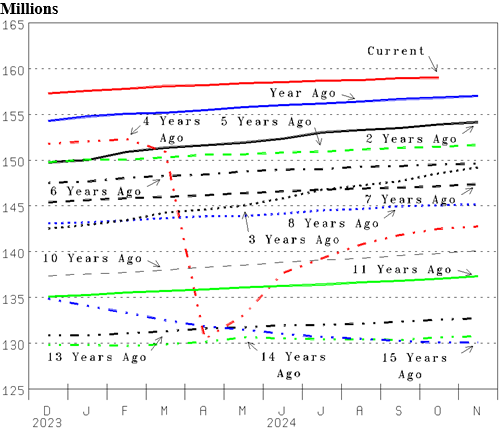
High uncertainty includes what government policies will be as year 2025 begins. Free markets still dominating the U.S. keep us predicting: UP is the direction we head. This morning’s U.S. jobs report shows a disappointing 12,000 employment increase (Figure 10, red line). 113,000 was expected. And, August was revised down 81,000 to 78,000 and September was revised down 31,000 to 223,000. Nevertheless, the 12,000 increase has 159.005 million the October employment level, 2.173 million more than last year (blue line), a 1.4% year-over-year increase. There is no sign of the decline that happens when growth changes to recession, like it did in March of 2020 (red, dot-dot dash) and Crash 2008 (blue, dot-dot dash). We predict that privileged-focused and eliminating mankind’s CO2 emissions policies will have growth slower if at all, and more restricted.

By Michael Smolinski with Energy Directions for oilandgas360.com


